

Zero Gamma, Call Wall and Put Wall Explained
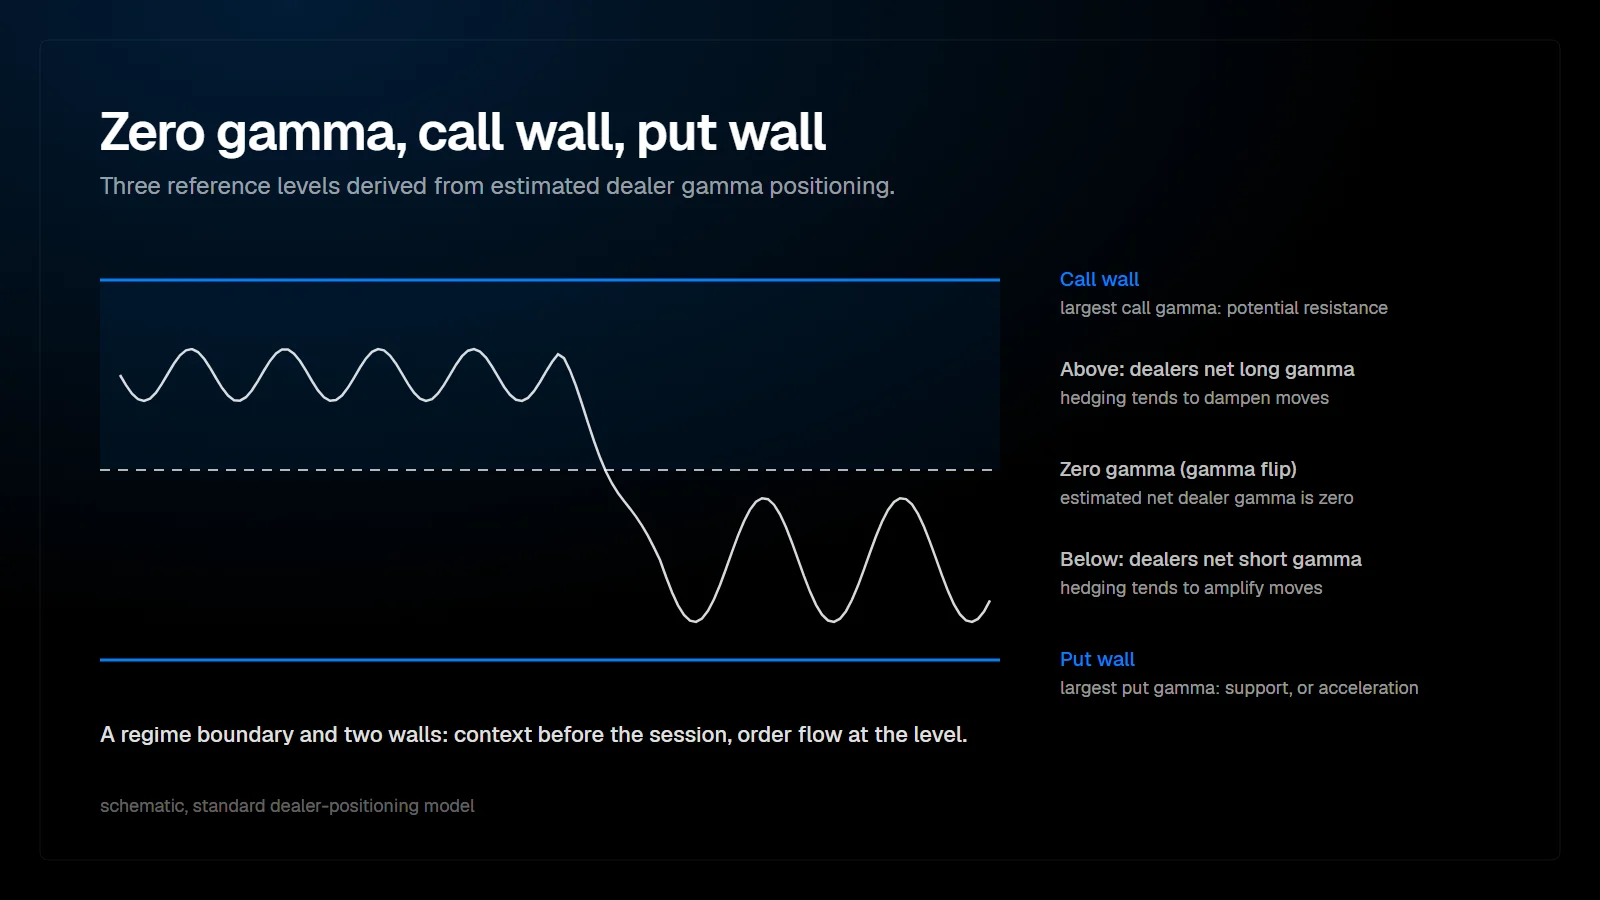
Zero gamma, the call wall and the put wall are three reference levels derived from dealer gamma positioning. Zero gamma is the price where estimated net dealer gamma flips from positive to negative. The call wall and the put wall are the strikes with the largest call and put gamma. Together they outline where hedging may dampen or amplify moves.
What is dealer positioning?
The aggregate options inventory that market makers hold, and the hedging it requires.
Options dealers provide liquidity to customers and usually hedge the resulting directional exposure in the underlying or its futures. Their net position across strikes and expirations determines how that hedge must change as price moves. Because exchanges do not publish who holds which side, dealer positioning is always an estimate built from open interest and assumptions about customer behavior.
The article on gamma levels explains how gamma exposure is calculated and why the sign assumption matters. This article covers the three levels most commonly derived from it.
What is the zero gamma level?
Zero gamma, also called the gamma flip, is the underlying price at which estimated total dealer gamma sums to zero.
It is found by recalculating total gamma exposure across a range of hypothetical underlying prices and locating where the total crosses zero. Above the level, the model shows dealers net long gamma; below it, net short gamma. It is not a strike but a computed price, and it moves as price, time and open interest change.
Its practical meaning is a change in the expected character of the tape. Above zero gamma, hedging tends to lean against moves; below it, hedging tends to add to them. Traders use it as a regime boundary rather than as a precise turning point.
What are the call wall and the put wall?
The call wall is the strike with the largest call gamma exposure; the put wall is the strike with the largest put gamma exposure.
Some providers define them by open interest instead of gamma, which gives similar but not always identical strikes. Under the standard assumption, the call wall is where dealer hedging against further upside concentrates, and the put wall is where hedging activity on the downside concentrates.
| Level | Definition | Common interpretation | What weakens it |
|---|---|---|---|
| Zero gamma (gamma flip) | Price where estimated net dealer gamma is zero | Boundary between dampening and amplifying regimes | Large changes in open interest; expiration |
| Call wall | Strike with the largest call gamma | Potential resistance area where upside hedging concentrates | Positions rolled higher; customers net long calls |
| Put wall | Strike with the largest put gamma | Potential support area, or an acceleration point once broken | Puts closed; price already below zero gamma |
Interpretations describe tendencies under the standard positioning model.
Why does a wall not always hold?
Because a wall is a concentration of hedging flow, not an order that has to be filled.
When price approaches a large call strike from below in a positive gamma environment, dealers selling into the rally can slow the move. But if customers buy more calls, roll positions up, or macro flow is strong, the hedging is overwhelmed and the strike can be passed. The put wall is less symmetric: below it, the market is often already in negative gamma, where hedging adds to selling rather than leaning against it.
This is where order flow becomes the deciding input. A call wall where the footprint shows aggressive buying being absorbed is behaving as the model suggests. A call wall that price moves through on heavy positive delta, with no absorption, is not.
How do expirations change the levels?
Expiration removes gamma. Standard monthly options on the S&P 500 and the Nasdaq-100 expire on the third Friday of the month, and the quarterly expirations fall in the same weeks as the futures roll. Same-day expiring options add a large amount of short-lived gamma concentrated near the current price.
- Before a large expiration, levels can be dominated by strikes that are about to disappear.
- After it, the remaining open interest sets new walls and a new zero gamma level.
- Same-day options are not in the prior day's open interest, so intraday positioning can differ from the morning's levels.
How do ES and NQ traders use these levels in practice?
As context set before the session, not as entries.
| Before the session | During the session |
|---|---|
| Note zero gamma and whether price opens above or below it | Check whether the tape matches the regime: rotation above, trend below |
| Mark the call wall and the put wall, converted to futures prices | Read order flow when price approaches a wall: absorption or acceptance? |
| Check for large expirations in the week | Expect levels to shift after the expiration |
The conversion to futures prices is essential. SPX and NDX strikes need the current futures basis added before they match ES and NQ prices.
PFT Forge, the options module currently in development, is being built to put these levels onto ES and NQ charts. It is not released, and there is no price or release date yet.
FAQ
Is zero gamma the same as the gamma flip?
Yes. Both terms describe the price at which estimated net dealer gamma changes sign.
Is the call wall a hard ceiling?
No. It is a concentration of hedging flow that can slow a rally in a positive gamma environment. Strong buying or changes in positioning can move price through it.
How often do these levels change?
At least daily, when open interest updates, and materially around expirations. Intraday, zero gamma also shifts as price and time to expiry change.
Do I need options data to trade ES or NQ?
No. Many order flow traders do without it. Gamma levels are an additional context layer that helps explain some of the behavior around large strikes.
This article is educational content, not financial advice.