

Absorption vs. Exhaustion in Order Flow
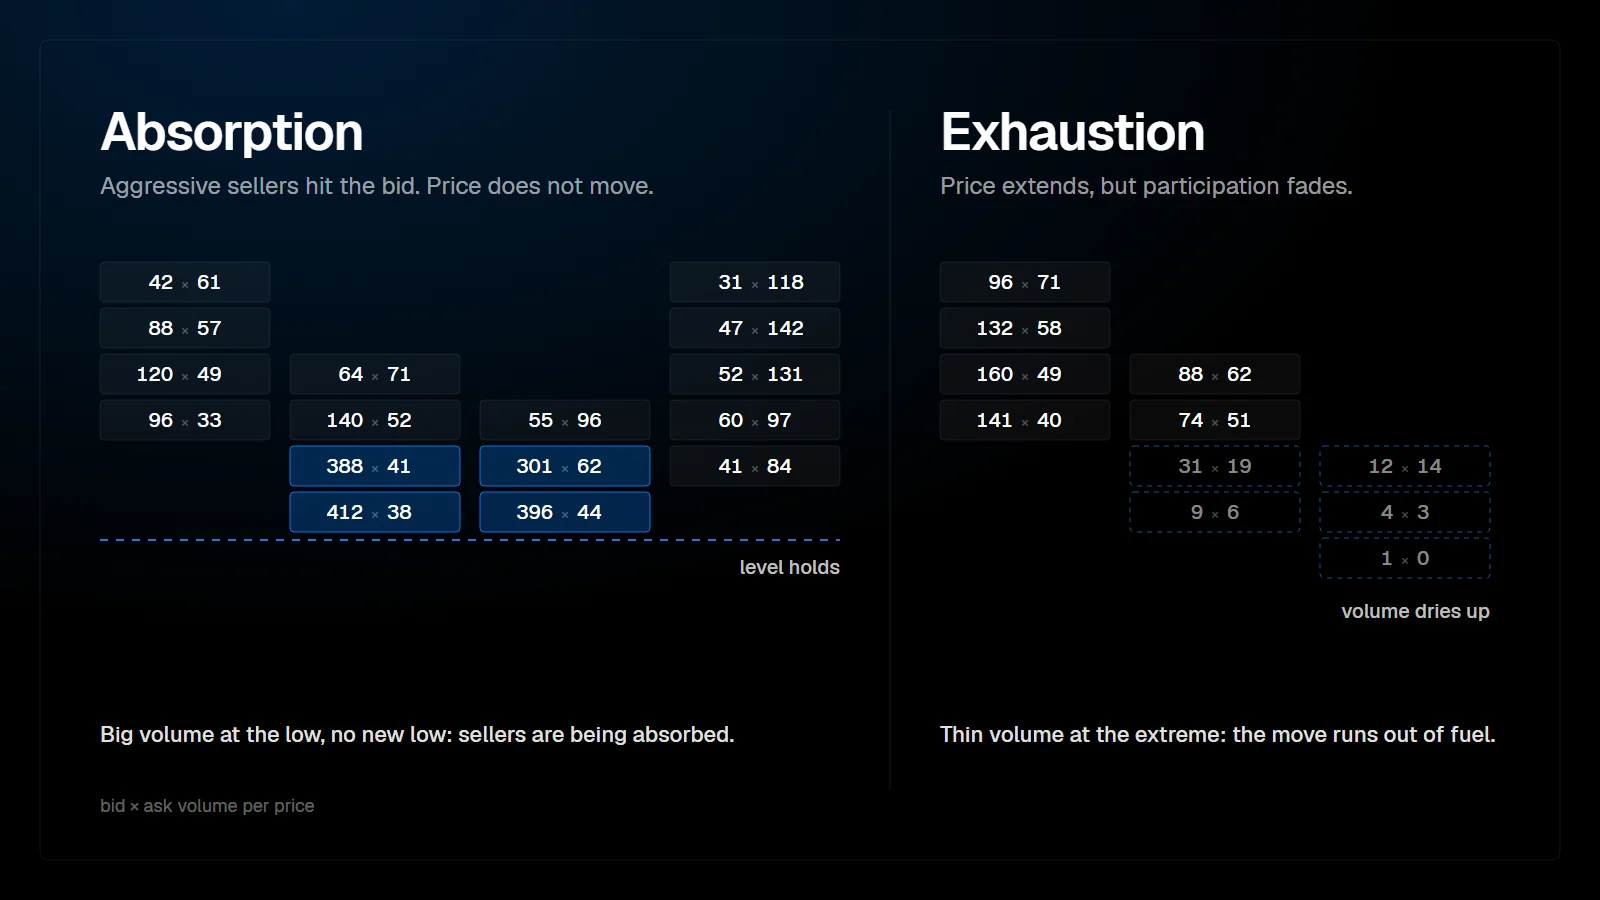
Absorption and exhaustion both appear at turning points, but they are opposites. Absorption is heavy aggressive volume that fails to move price because passive orders take the other side. Exhaustion is a move that runs out of aggressive participants, so volume and delta fade at the extreme. One is effort without result, the other is the end of effort.
What is absorption?
Large aggression, little movement.
Absorption happens when aggressive market orders meet enough passive limit orders to stop price. Sellers hit the bid again and again, the bids keep refilling, and the low holds. On a footprint you see high volume on the aggressive side concentrated at or near an extreme, and a bar that does not extend.
The absorbing side is often not fully visible in the DOM. Iceberg orders and refilled limit orders show only part of their size, which is why absorption is usually read from executed volume rather than from displayed depth.
What is exhaustion?
The aggressive side stops showing up.
Exhaustion is a lack of participation at the end of a move. As price pushes into new highs, the volume traded at the ask gets smaller at each new price. The last prints at the high are thin and delta weakens. Price reaches a level where no one is willing to buy higher, and the auction stalls for lack of buyers rather than because of sellers.
On a footprint, exhaustion shows as declining volume toward the bar's extreme, sometimes ending in very small numbers or a zero on the aggressive side at the high or low. That is also the signature of a finished auction.
How do absorption and exhaustion differ?
| Feature | Absorption | Exhaustion |
|---|---|---|
| Volume at the extreme | High | Low and declining |
| Delta | Strong in the direction of the attack | Weakening toward zero |
| Cause of the stall | Passive orders meet aggression | Aggressive orders dry up |
| Footprint signature | Large numbers on one side at the low or high | Small numbers, sometimes zero, at the extreme |
| What often follows | A fast move away once the attackers give up | A slower rotation as the other side begins to trade |
| What invalidates it | Price breaks through the absorbed level | Aggression returns and price extends |
Typical characteristics. Individual cases vary; these are tendencies, not rules.
How do you tell them apart in real time?
Compare the volume at the extreme with the volume that built the move.
If the last push into a low carried more selling volume than the pushes before it, and the low held, that is absorption: the effort went up, the result did not. If the last push carried less selling, and each new low printed on smaller numbers, that is exhaustion: effort faded along with the result.
- Check the delta of the final push against earlier pushes in the same swing.
- Check the footprint at the extreme: large numbers suggest absorption, thin numbers suggest exhaustion.
- Check CVD: with absorption, CVD often keeps moving with the attack while price stalls; with exhaustion, CVD flattens together with price.
- Check the next bars: absorption tends to release sharply, exhaustion tends to rotate.
Why does the difference matter for trading decisions?
Because the two lead to different expectations about speed and risk.
After absorption, the aggressive side is trapped. Sellers who hit the bid heavily at a low that held are now short at a price the market refused. If they have to cover, their buying adds to the move away. Absorption turns can therefore be fast, and the invalidation is clear: the absorbed level breaking.
After exhaustion, nobody is trapped in the same way. The move simply ran out of fuel. The rotation that follows is often slower and can turn into a range. A stop beyond the exhaustion extreme is logical, but expectations for immediate follow-through should be lower.
In both cases the read is stronger at a level defined before the session. Absorption at the prior day low or exhaustion at the value area high carries more information than either pattern in the middle of a range.
Can absorption and exhaustion appear together?
Yes, and the combination is common at important turns. A move exhausts into a level, aggressive buyers or sellers thin out, and the last attempts are absorbed by passive orders on the other side. The footprint then shows declining aggression into the extreme, followed by a final burst of volume that goes nowhere.
Tools that flag large trades help here. The PFT Institutional Detector marks the largest executed trades and tags recurring levels as absorption or rejection, which makes it easier to see where size met the market at an extreme.
FAQ
Is absorption bullish or bearish?
Neither by itself. Absorption of selling at a low is a potential bullish sign; absorption of buying at a high is a potential bearish sign. The direction depends on which side is being absorbed.
What is a zero print in a footprint?
A zero on the aggressive side at a bar's extreme, for example no volume at the ask at the high. It means no buyer crossed the spread at that price, which is typical of a finished auction and often of exhaustion.
Can I see absorption in the DOM?
Sometimes, as limit orders that refill after being hit. Because orders can be hidden or pulled, executed volume in the footprint is usually the more reliable evidence.
Which is more reliable, absorption or exhaustion?
Neither is reliable in isolation. Their value comes from location and from what the next bars confirm.
This article is educational content, not financial advice.