

What Is Order Flow Trading? A Guide for ES and NQ
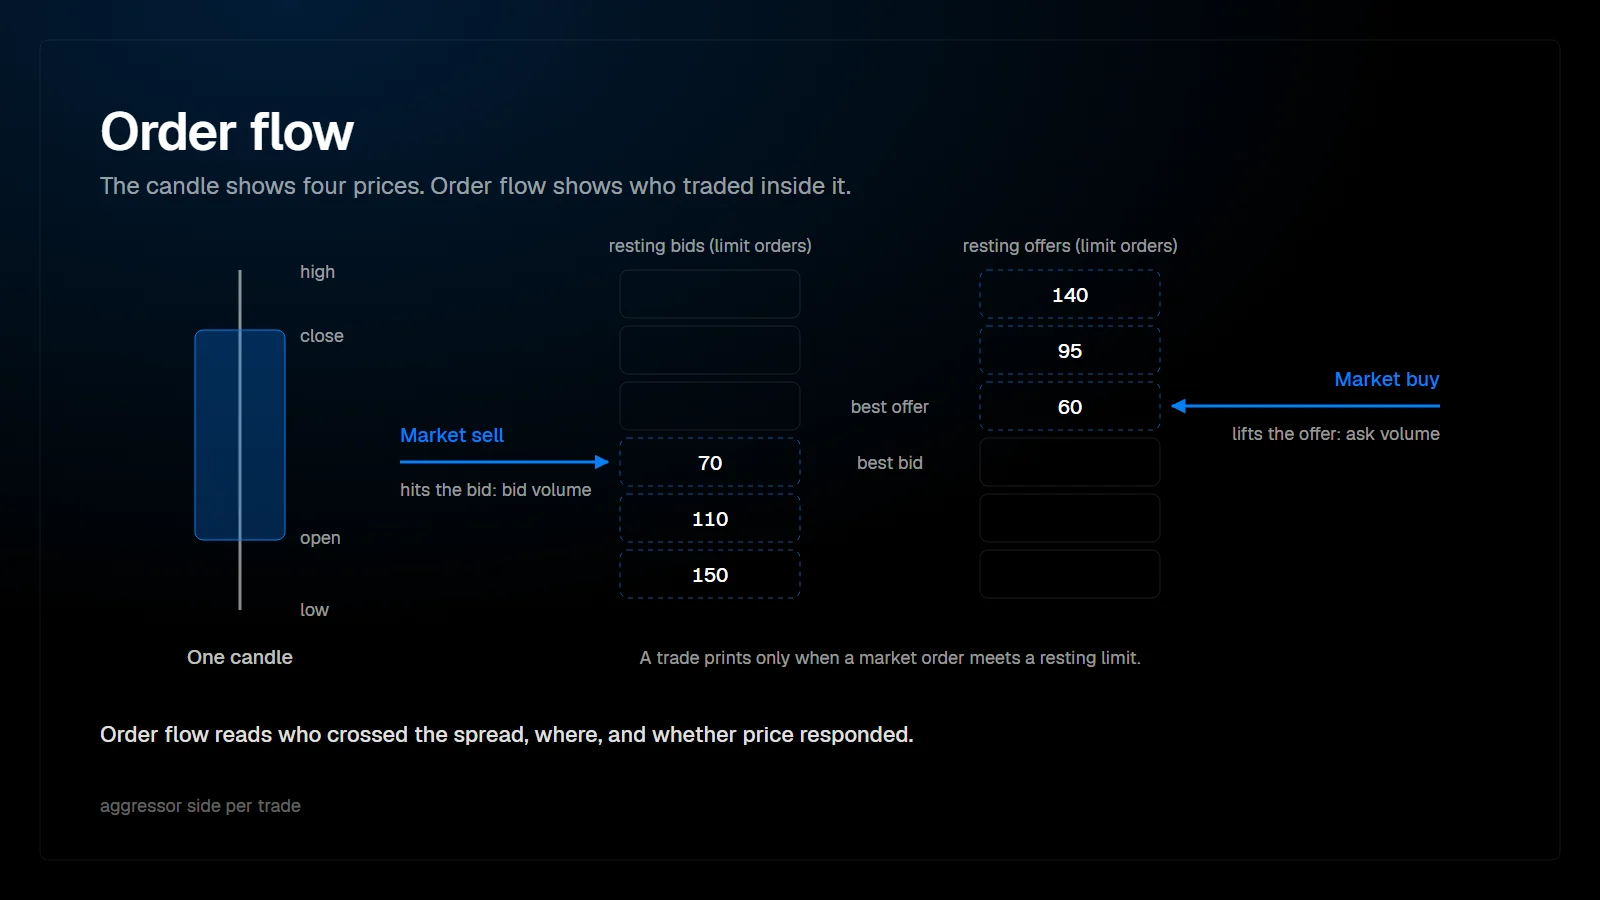
Order flow trading is the practice of reading the actual transactions in a market, who bought at the offer and who sold at the bid, and at which prices, to understand how price is being moved. In ES and NQ futures every trade carries an aggressor side, so order flow can be measured directly instead of inferred.
What does order flow actually measure?
Order flow measures the interaction between two kinds of orders. Market orders demand immediate execution and cross the spread. Limit orders wait in the order book at a chosen price. A trade happens only when one meets the other.
The side that crossed the spread is called the aggressor. When a market buy order lifts the offer, the trade is recorded as buying volume at the ask. When a market sell order hits the bid, it is recorded as selling volume at the bid. CME Globex reports the aggressor side with each trade in its market data, which is why futures order flow tools can split volume into buyers and sellers without guessing.
Everything else in order flow is built on that split. Delta, cumulative delta, footprint imbalances and absorption are all ways of summarizing who was aggressive, where, and with what result.
Why do futures traders use order flow instead of indicators alone?
Order flow shows the cause of a price move, while most classic indicators show a transformation of price after the fact. A moving average tells you where price has been. The tape tells you whether the last push was driven by aggressive buyers, or whether price drifted up because sellers stepped away.
That difference matters most at decision points. At a prior high, a break with heavy aggressive buying and follow-through reads differently from a break on thin volume that immediately stalls. On a line chart both cases look the same. The transactions do not.
ES and NQ suit this approach because they are centralized, exchange-traded contracts. All volume prints on one venue, so the data you see is the complete record for that contract rather than one fragment of a fragmented market.
Which tools make up an order flow workspace?
Most order flow traders combine a small number of views. Each one answers a different question, and none of them is a signal on its own.
| Tool | What it shows | Question it answers |
|---|---|---|
| Time and sales (the tape) | Every trade with price, size and aggressor side | Who is hitting right now, and how large? |
| DOM (depth of market) | Resting limit orders at each price near the market | Where is liquidity waiting, and does it hold or pull? |
| Footprint chart | Volume at bid and ask for each price inside each bar | Where inside the bar did buyers or sellers dominate? |
| Delta | Ask volume minus bid volume per bar | Which side was more aggressive in this bar? |
| Cumulative volume delta (CVD) | Running total of delta over a session | Is aggression building or fading across the move? |
| Volume profile | Total volume traded at each price over a period | Where did the market accept or reject price? |
Common order flow views. Platforms name them differently, but the underlying data is the same.
How do ES and NQ differ for order flow traders?
Both contracts trade on CME Globex with a minimum tick of 0.25 index points, but the value of that tick and the character of the tape differ.
| Contract | Tick size | Tick value | Micro contract tick value |
|---|---|---|---|
| E-mini S&P 500 (ES) | 0.25 points | $12.50 | MES: $1.25 |
| E-mini Nasdaq-100 (NQ) | 0.25 points | $5.00 | MNQ: $0.50 |
Contract specifications as published by CME Group.
ES typically shows deeper resting liquidity per price level and moves through fewer ticks for a comparable percentage move. NQ covers more ticks, so its footprint bars are taller and its book is thinner at each level. The practical consequence: size thresholds that mean something in ES, such as what counts as a large print, do not transfer one to one to NQ. Calibrate filters per instrument.
How do you read order flow without drowning in data?
Start with location, not with the tape. Order flow is most useful at prices that already matter: the prior day's high and low, the value area edges, the VWAP, an overnight extreme. Away from those prices, most of the tape is activity from participants with unrelated time frames.
Then ask a narrow question. At the level, is aggression getting through or being absorbed? If sellers hit the bid heavily and price does not move lower, passive buyers are absorbing that selling. If buyers lift the offer and price keeps travelling with little effort, the path of least resistance is up for now.
- Pick the level before the market gets there.
- Watch aggression and response at that level, not everywhere.
- Look for confirmation: does the next bar follow through, or does the other side take over?
- Journal the read and the outcome, so the pattern is judged on your own data rather than on memory.
This is where a journal earns its place. The PFT Terminal is a free trading journal that records trades from ATAS, NinjaTrader and Sierra Chart, including MAE and MFE per trade, which makes it possible to check afterwards whether a given order flow read actually held up.
What are the limits of order flow?
Order flow describes what happened, very precisely. It does not tell you what happens next. A large seller absorbed at a level can stop absorbing on the next print. Iceberg orders show only part of their size in the book. Resting orders in the DOM can be pulled before price reaches them, so displayed liquidity is an intention, not a commitment.
Order flow also needs context from higher time frames and from the session's structure. A buying imbalance in the middle of a range weighs less than the same imbalance at the edge of the prior day's value. Used this way, order flow is a decision filter for discretionary trading, not a mechanical signal generator.
FAQ
Is order flow trading only for scalpers?
No. Scalpers use it for entries measured in ticks, but intraday and swing traders use the same data to judge whether a breakout is accepted or a level is defended. The time frame changes how much of the tape matters, not whether it matters.
Do I need Level 2 data for order flow?
For footprint, delta and volume profile you need tick-by-tick trade data with the aggressor side. For the DOM you need market depth. Most futures data feeds provide both, but depth is usually limited to a fixed number of price levels.
Is order flow better on ES or NQ?
Neither is better in general. ES tends to show clearer absorption at levels because of deeper liquidity, while NQ moves through more ticks and rewards faster reading. Pick one, learn its typical sizes, and recalibrate before switching settings between them.
Can order flow be automated?
Parts of it can be measured automatically, such as delta, imbalances or large prints. Judging whether those readings matter at the current location is discretionary, and that is where most of the work lies.
This article is educational content, not financial advice.