

Delta Divergence: Reading Absorption in Order Flow
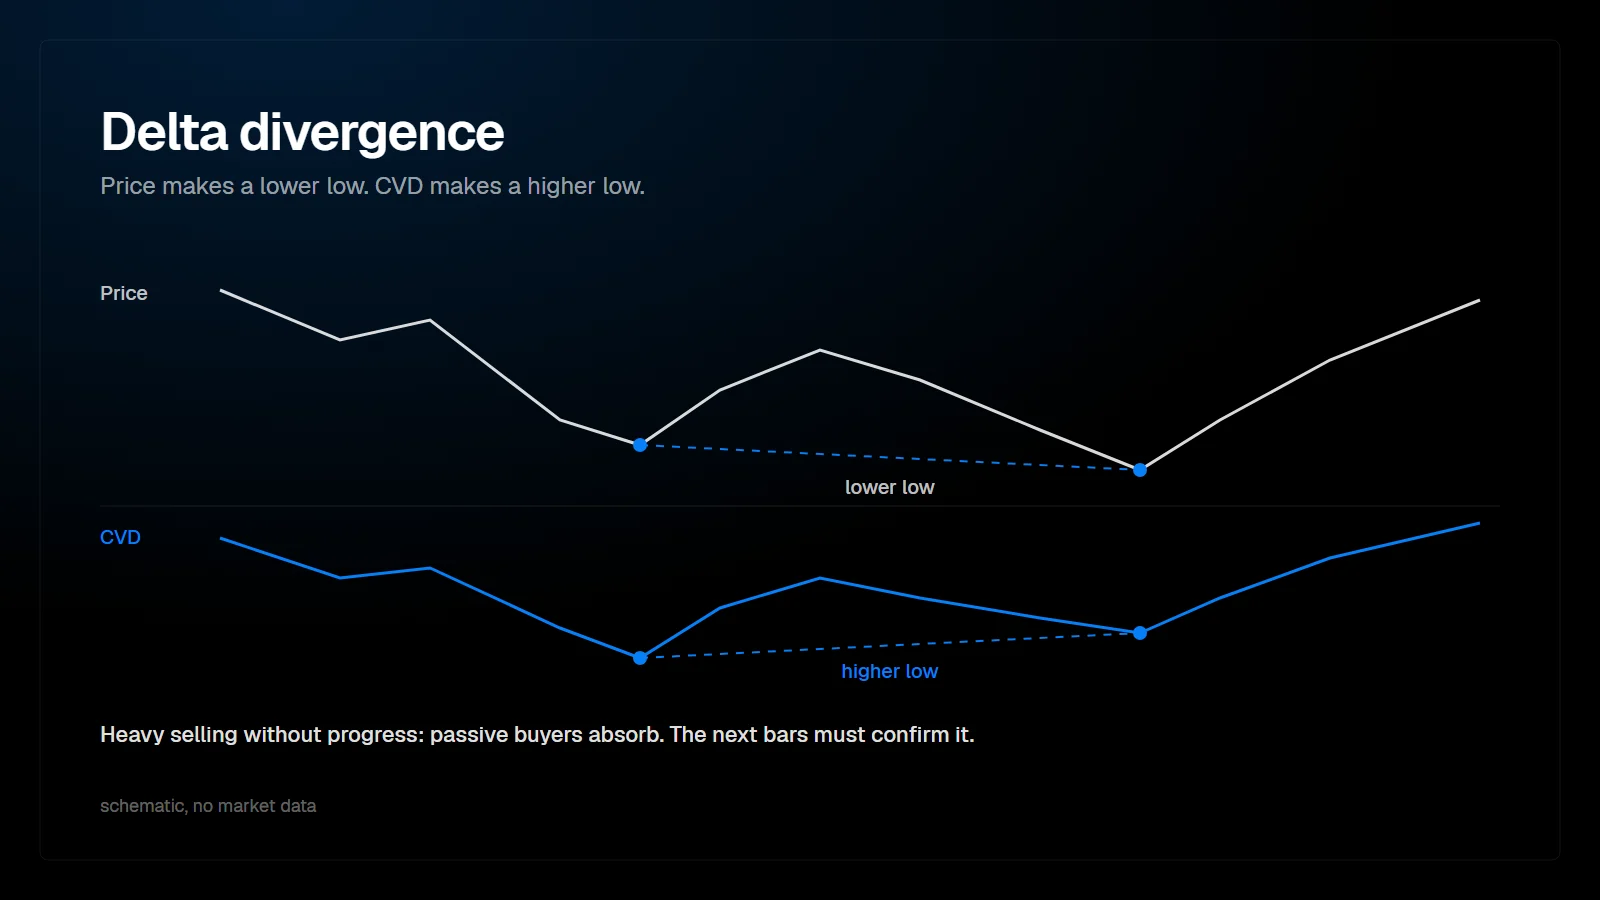
A delta divergence is a disagreement between aggression and price: strong negative delta while price holds or rises, or strong positive delta while price holds or falls. It usually means passive limit orders are absorbing the aggressive side. Read at a meaningful level, it is one of the clearest absorption signals in order flow.
What is a delta divergence?
The side that is attacking is not getting paid.
Delta measures net aggression: volume at the ask minus volume at the bid. Normally strong negative delta comes with falling prices, because sellers crossing the spread consume the bids and push price down. When that relationship breaks, and price stays put or moves the other way despite heavy selling, someone is absorbing the selling with limit orders.
The divergence shows up at three scales.
| Type | Where you see it | Example |
|---|---|---|
| Bar divergence | A single bar or footprint candle | A bar closes above its open with negative delta |
| Swing divergence | CVD against price across several bars | Price makes a lower low, CVD makes a higher low |
| Level divergence | Heavy delta concentrated at one price | Repeated large bid volume at the same price without a new low |
Three common forms of delta divergence.
Why does delta divergence signal absorption?
Because every trade needs two sides. If sellers hit the bid for thousands of contracts and price does not drop, the bids were refilled as fast as they were consumed. That is the definition of absorption: passive orders taking the other side of aggressive flow without letting price move.
Absorption does not tell you who the passive buyer is or why they are buying. It tells you that at this price, for now, demand is large enough to meet the selling. When aggressive sellers run out, price is free to move away from the absorbing side, often quickly, because the sellers who just sold are now positioned against the move.
This is why we read delta divergence primarily as an absorption signal rather than as a momentum indicator. The question is not whether delta is high or low, but whether aggression is producing movement.
How do you spot absorption on a footprint chart?
On a footprint, absorption shows up as large volume on one side concentrated in a few prices, with price failing to extend beyond them.
- Large bid volume stacked at the low of a bar or a series of bars, with the low holding.
- Negative bar delta, but the bar closes in its upper half.
- Price revisits the same low several times, each time with heavy selling, and does not break it.
- After the absorption, delta flips positive and price leaves the level.
The mirror image applies at highs: large ask volume at the top, positive delta, no progress in price, and a later flip to negative delta.
How do you confirm a delta divergence?
Confirm it with location first and follow-through second.
Location: a divergence in the middle of a range is weak evidence. At a prior day high or low, a value area edge, a VWAP deviation band or an overnight extreme, it carries more weight, because those are prices where larger participants have a reason to act.
Follow-through: absorption is only proven when the absorbing side takes over. After heavy selling is absorbed at a low, look for the next bars to show positive delta and price moving away from the level. If the low breaks on continued selling instead, the absorbing buyers have been overrun, and the divergence was a pause, not a turn.
| Situation | Delta | Price | Reading |
|---|---|---|---|
| Selling into support | Strongly negative | Holds the level | Possible absorption by passive buyers |
| Same, next bars | Flips positive | Leaves the level upward | Absorption confirmed |
| Same, next bars | Stays negative | Breaks the level | Absorption failed; sellers overran the bids |
| Buying into resistance | Strongly positive | Stays below the level | Possible absorption by passive sellers |
How a divergence develops. Readings are interpretations, not rules.
What makes a delta divergence unreliable?
- Low volume. A divergence built on a few hundred contracts in a thin overnight market says little.
- Trend days. In a strong trend, price can diverge from delta repeatedly while the trend continues, because limit orders on the trend side lean on every pullback.
- News releases. Around scheduled data, liquidity is pulled and delta readings in the first seconds are distorted.
- Wrong reset. A CVD divergence depends on where CVD starts. Compare swings within the same session.
How does delta divergence fit into a trading process?
Delta divergence is a filter for decisions a trader already considers, not a trigger by itself. A practical sequence: mark the levels before the session, wait for price to arrive, observe whether aggression at the level produces movement, and act only when the response confirms the read.
Recording each case, including the ones that failed, turns a vague impression into something measurable. The free PFT Terminal journal stores MAE and MFE per trade, which shows whether absorption-based entries actually had room to work.
FAQ
Is delta divergence the same as CVD divergence?
CVD divergence is one form of delta divergence, measured across swings. Delta divergence also includes single bars and single price levels where aggression and price disagree.
Does absorption always lead to a reversal?
No. Absorption can end with the absorbing side being overrun, and then price often continues in the original direction with more force. That is why confirmation matters.
Can I see absorption without a footprint chart?
Partially. A delta histogram and CVD show the disagreement between aggression and price. The footprint adds where inside the bar it happened, which helps judge whether it occurred at the level that matters.
What delta size counts as heavy?
It depends on the instrument and the time of day. Compare against the typical delta of bars at the same time in recent sessions instead of using a fixed number.
This article is educational content, not financial advice.