

Cumulative Volume Delta (CVD) Explained
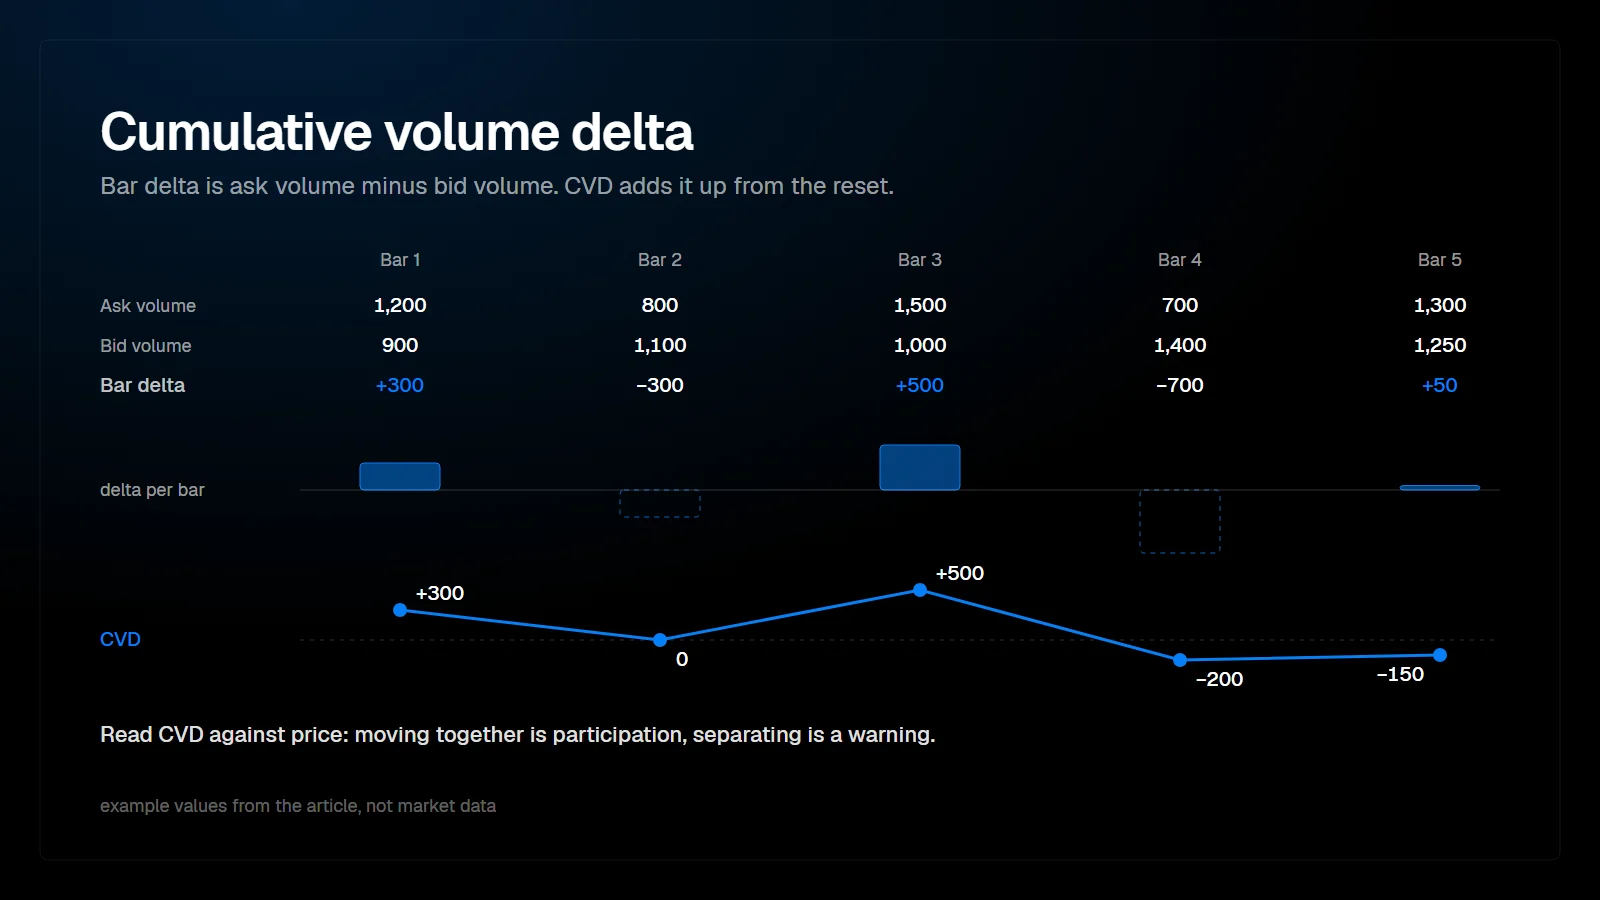
Cumulative volume delta (CVD) is the running total of delta, where delta is the volume traded at the ask minus the volume traded at the bid. It shows whether aggressive buyers or aggressive sellers have dominated since a chosen starting point, usually the session open, and whether price is moving with that aggression or against it.
How is cumulative volume delta calculated?
Take the delta of every bar and add it to the previous total.
Each trade in ES and NQ is tagged with its aggressor side. Volume from market buy orders that lifted the offer counts as ask volume. Volume from market sell orders that hit the bid counts as bid volume. Delta for a bar is ask volume minus bid volume. CVD adds each bar's delta to the running total from the reset point.
| Bar | Ask volume | Bid volume | Bar delta | CVD |
|---|---|---|---|---|
| 1 | 1,200 | 900 | +300 | +300 |
| 2 | 800 | 1,100 | -300 | 0 |
| 3 | 1,500 | 1,000 | +500 | +500 |
| 4 | 700 | 1,400 | -700 | -200 |
| 5 | 1,300 | 1,250 | +50 | -150 |
Example values for illustration, not market data.
The absolute CVD value has little meaning on its own. What matters is its direction and how it behaves relative to price.
When should CVD be reset?
Reset CVD at a point that matches the question you are asking. For intraday trading a session reset is the common choice, because it measures aggression within the current auction rather than carrying over yesterday's imbalance.
| Reset choice | What it measures | Typical use |
|---|---|---|
| Session (RTH open) | Aggression within the regular trading session | Day trading the cash session |
| Globex session (18:00 New York time) | Aggression across the full electronic session | Traders who include overnight activity |
| Anchored to an event | Aggression since a specific high, low or news release | Judging a single move or breakout |
| No reset | Aggression over the whole loaded history | Rarely useful intraday; the line drifts with data length |
The last row is a common mistake. Without a reset, CVD depends on how many days the chart happens to load, and two traders with different history settings see different lines.
How do you read CVD alongside price?
Read CVD as confirmation or non-confirmation of price. When price and CVD rise together, the advance is driven by aggressive buying. When they separate, something else is going on.
- Price up, CVD up: buyers are initiating and price responds. The move has participation.
- Price up, CVD flat or down: price rises without net aggressive buying. Either sellers are stepping away, or passive buyers are lifting their bids. Both are weaker forms of an advance.
- Price down, CVD down: sellers are initiating and price responds.
- Price flat, CVD falling hard: aggressive selling is met by passive buyers. That is absorption.
How do you read CVD divergence?
A CVD divergence occurs when price makes a new extreme but CVD does not, or the reverse. The classic case at a high: price prints a higher high while CVD prints a lower high.
Two readings are possible, and location decides between them. Either buyers have lost aggression and price is rising on residual momentum, or sellers are absorbing buyers passively at the high. In both cases the higher high was not built on stronger buying than the previous one.
The opposite case is often the more useful one. Price pushes into a prior low with strongly negative delta but fails to extend. Heavy selling that does not move price means passive buyers are taking the other side. In our approach this delta divergence is read primarily as an absorption signal, which the article on delta divergence and absorption covers in detail.
A divergence is a warning, not a trigger. It needs a level, and it needs the next bars to confirm that the absorbing side is now in control.
What are common mistakes with CVD?
- Comparing CVD values across instruments. ES and NQ trade different volumes per point, so the scales are not comparable.
- Reading CVD in low-volume periods. Overnight CVD on thin volume swings easily and says little about the cash session.
- Treating every divergence as a reversal. In strong trends, divergences can appear repeatedly while price keeps going.
- Ignoring the reset. A CVD line without a defined start is hard to interpret.
Is CVD the same on every platform?
In CME futures the aggressor flag comes from the exchange, so the underlying split is the same everywhere. Differences come from how platforms aggregate data, whether they filter by trade size, and where they reset. In markets without an aggressor flag, platforms have to infer the side from price changes, which is an approximation.
In ATAS the built-in Cumulative Delta indicator plots CVD in a separate pane with a configurable reset. The PFT Market Matrix uses session delta as one of its sixteen factors, next to VWAP and value area, and folds it into a single bias read instead of displaying it as a line.
FAQ
What is the difference between delta and CVD?
Delta is the difference between ask and bid volume in one bar. CVD is the sum of all bar deltas since the reset point. Delta describes one bar, CVD describes the whole move.
Is positive CVD bullish?
Not by itself. Positive CVD means more volume traded at the ask than at the bid since the reset. If price is not rising with it, the buying is being absorbed, which can be the opposite of bullish.
Which time frame is best for CVD?
The CVD value at a given moment does not depend on the bar size, because it only sums the trades since the reset. The bar size changes how the line looks, not what it measures.
Can CVD predict reversals?
No indicator predicts. A CVD divergence shows that price and aggression disagree, which can precede a reversal. Whether it does depends on location and on what the next bars show.
This article is educational content, not financial advice.