

Volume Profile, POC and Value Area for Futures
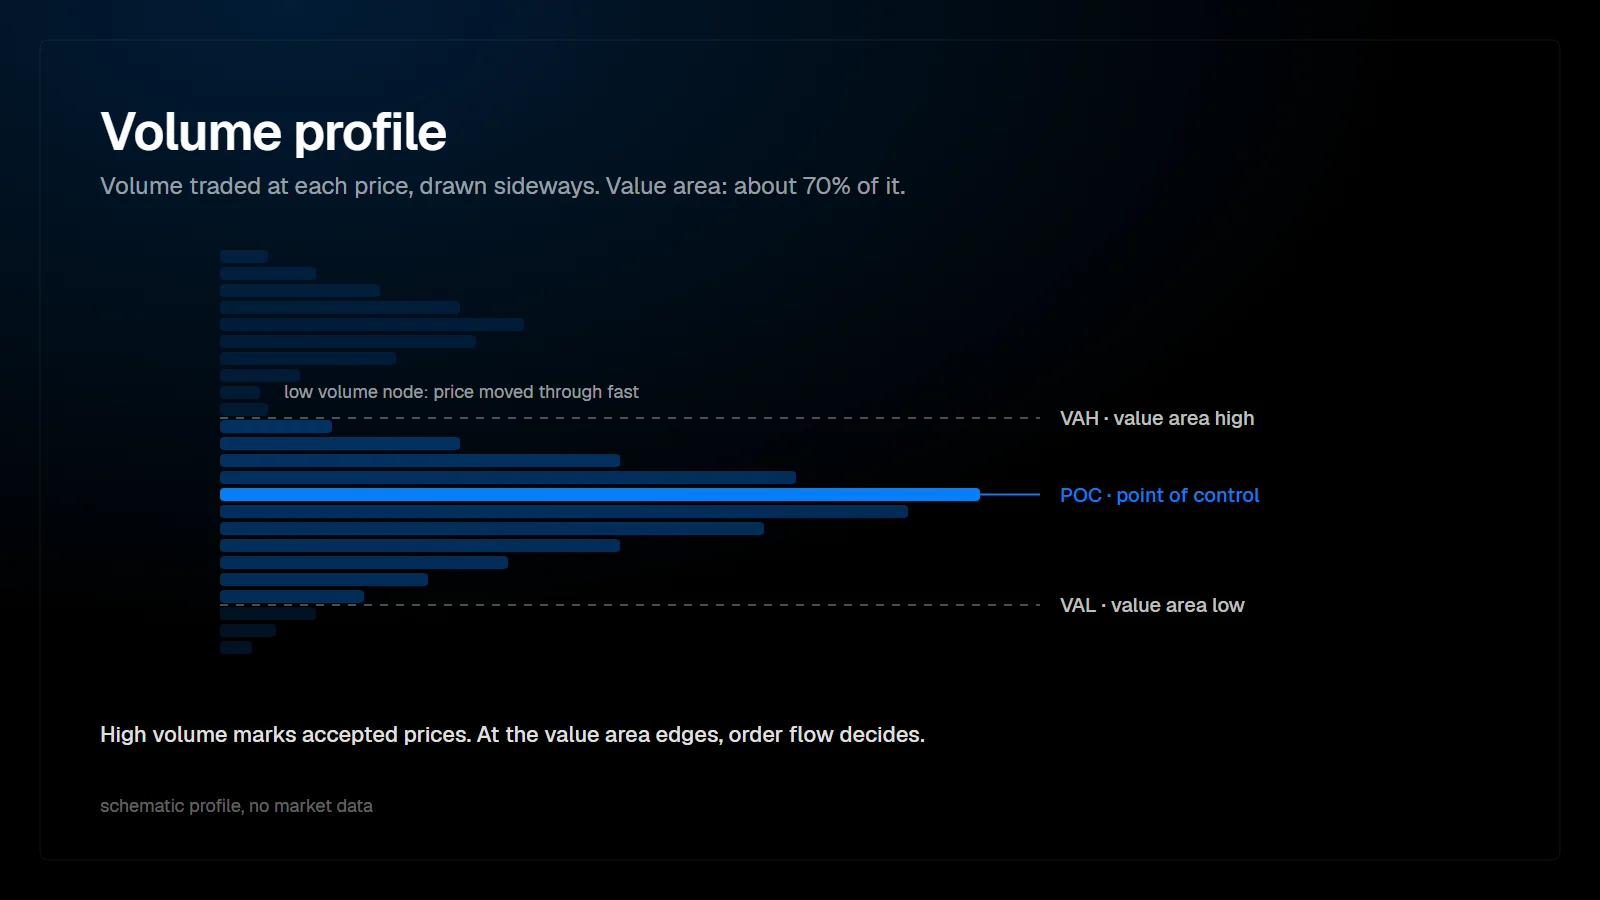
A volume profile shows how much volume traded at each price over a chosen period. The price with the most volume is the point of control (POC). The value area is the range around the POC that holds about 70 percent of the period's volume. Together they show where the market accepted price and where it rejected it.
What is a volume profile?
A histogram of volume by price, drawn sideways.
A time-based chart answers when price traded. A volume profile answers where it traded and how much. It is built by summing all contracts executed at each price over a period, such as one session, a week or a custom range, and drawing the totals as horizontal bars.
The idea comes from auction market theory: a market moves to find prices where both sides are willing to trade. Prices with high volume are where that trade happened readily. Prices with low volume are where the market moved through quickly, because one side refused to participate.
What are the key volume profile terms?
| Term | Definition | How traders use it |
|---|---|---|
| Point of control (POC) | The price with the highest traded volume in the period | Reference for fair value; price often reacts on a return |
| Value area (VA) | The range around the POC containing about 70% of volume | Defines where the period's accepted trade took place |
| Value area high (VAH) | Upper edge of the value area | Reference for acceptance or rejection above value |
| Value area low (VAL) | Lower edge of the value area | Reference for acceptance or rejection below value |
| High volume node (HVN) | A local peak in the profile | Area where price tends to slow down and rotate |
| Low volume node (LVN) | A local gap in the profile | Area price tends to move through quickly |
The 70 percent value area is a convention borrowed from market profile, loosely based on one standard deviation.
How is the value area calculated?
Start at the POC and add the price levels with the most volume on either side until 70 percent of the total is included.
The common method compares the volume of the next two prices above the current range with the next two below, adds the larger pair, and repeats. Platforms differ in details, such as whether they step one or two prices at a time, so value area edges can differ by a tick or two between platforms. For discretionary decisions that difference rarely matters. For backtests on exact levels, it does.
Session profile or composite profile?
Use the session profile for the current day's auction and a composite profile for the larger structure.
| Profile | Period | Question it answers |
|---|---|---|
| Developing session profile | Current session so far | Where is today's value forming, and is it moving? |
| Prior session profile | Yesterday's session | Where was value yesterday, and does today open inside or outside it? |
| Composite profile | Several days or weeks | Where are the major areas of acceptance and the gaps between them? |
| Anchored or range profile | A chosen move or range | Where did the volume of one specific move trade? |
For ES and NQ, many traders separate the regular trading hours session from the overnight Globex session, because overnight volume is thinner and can shift the POC in ways the cash session later ignores.
How do traders read price relative to value?
The core question is acceptance. Does price trade and build volume at new prices, or does it reject them and return to value?
- Open inside prior value: the market is balanced relative to yesterday, and rotations between VAH and VAL are common.
- Open outside prior value and hold: the market is accepting new prices, and the prior value edge becomes a reference.
- Open outside prior value and return: the move away from value failed, and the prior POC often becomes the next reference.
- Price entering an LVN: expect speed until the next HVN.
These are reference frameworks, not automatic trades. At the edges, order flow decides. Absorption at VAL after an open inside value reads differently from aggressive selling that breaks through it with follow-through.
What is a naked POC?
A naked or virgin POC is a prior session's point of control that price has not traded at since. Some traders track them as potential reaction levels. There is no guarantee that price returns; they are simply prices where the market once found strong two-sided trade.
Where does volume profile fit in an order flow workflow?
Volume profile provides the map, order flow provides the read at each location. The profile tells you which prices matter; the footprint and delta tell you what participants do when price arrives there.
The PFT Market Matrix uses value area and VWAP among its sixteen factors when forming its bias read, so the position of price relative to value feeds into one context view instead of being checked by hand. The PFT Institutional Detector adds a dollar volume profile next to its large-trade levels.
FAQ
Is volume profile the same as market profile?
They are related but not the same. Market profile (TPO) counts time spent at each price; volume profile counts contracts traded at each price. Both produce a POC and a value area, and the two can differ.
Why 70 percent for the value area?
It is a convention from market profile that approximates one standard deviation of a normal distribution. It is not a law of the market, and some traders use other percentages.
Should I include overnight volume in the ES profile?
It depends on what you trade. If you trade the cash session, a separate RTH profile avoids distortion from thin overnight trade. If you trade around the clock, a full Globex profile is more consistent.
Does the POC act as support or resistance?
It often acts as a reference where price slows down, because it marks where the most two-sided trade took place. It is not a barrier; price can and does trade through it.
This article is educational content, not financial advice.