

VWAP for Futures Day Trading: Session VWAP and Bands
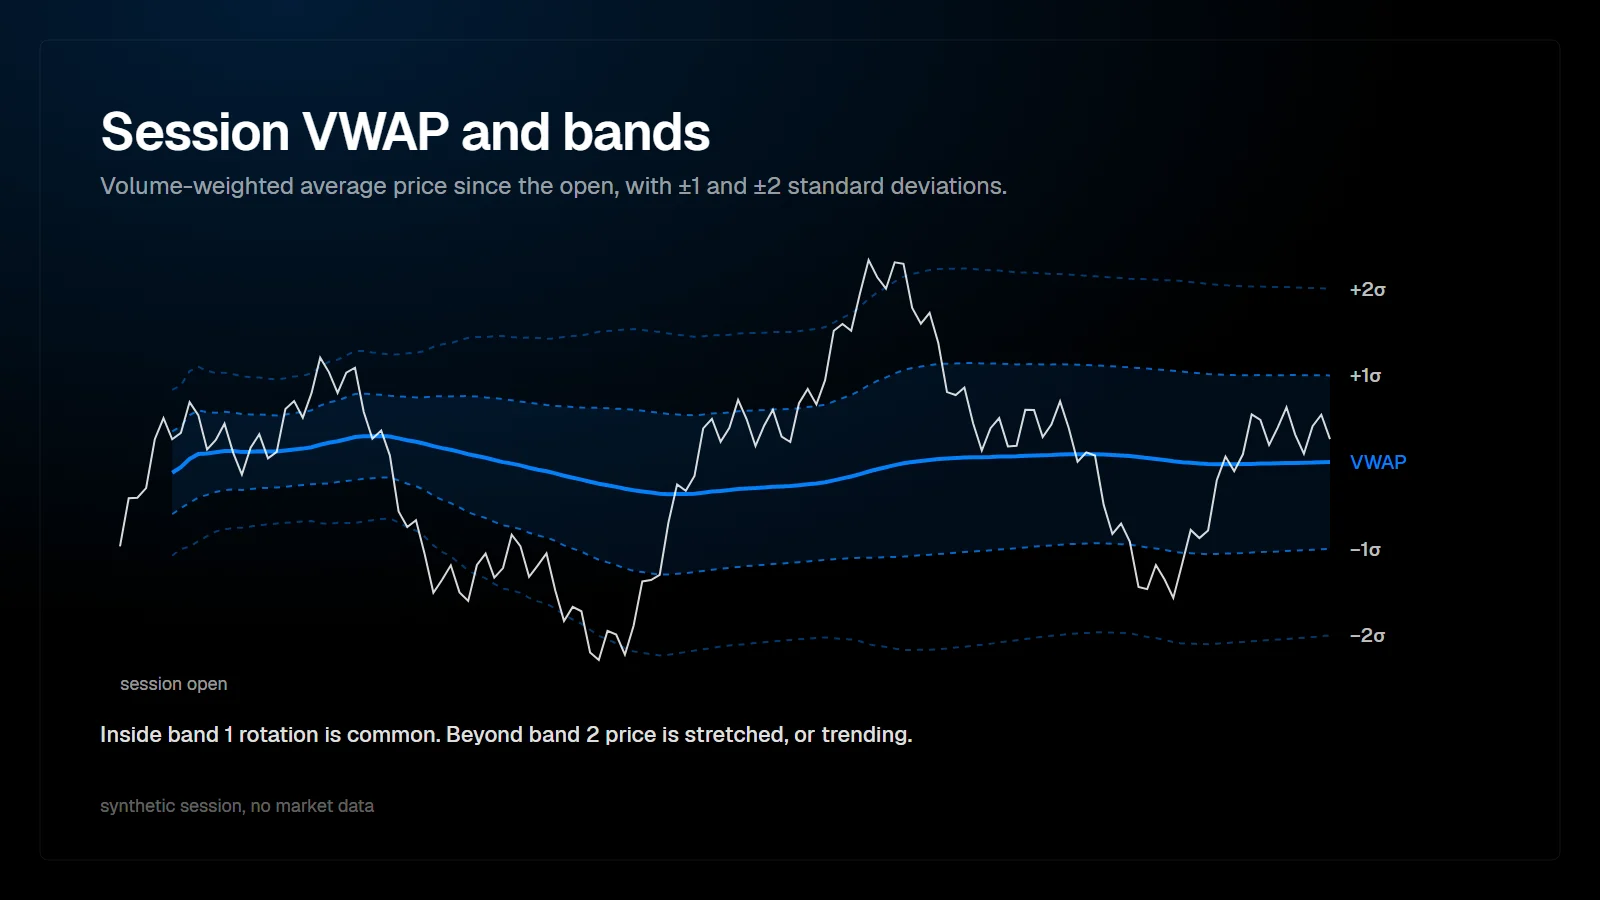
The volume-weighted average price (VWAP) is the average price of all contracts traded since a starting point, weighted by volume. For futures day traders it acts as the session's fair-value reference: price above VWAP means buyers since the open are, on average, in profit; price below it means sellers are.
How is VWAP calculated?
Cumulative price times volume, divided by cumulative volume.
For each trade or bar, multiply the price by the volume, add it to a running sum, and divide by the running sum of volume. Bar-based implementations often use the typical price, the average of high, low and close, as the price of each bar. Tick-based implementations use every trade price, which is more exact.
| Bar | Typical price | Volume | Price x volume (cumulative) | Volume (cumulative) | VWAP |
|---|---|---|---|---|---|
| 1 | 5000.00 | 2,000 | 10,000,000 | 2,000 | 5000.00 |
| 2 | 5002.00 | 1,000 | 15,002,000 | 3,000 | 5000.67 |
| 3 | 4998.00 | 3,000 | 29,996,000 | 6,000 | 4999.33 |
Example calculation with illustrative values.
Because it is volume-weighted, VWAP moves little when volume is light and more when heavy volume trades away from it.
Should ES VWAP start at the Globex open or the RTH open?
It depends on the session you trade. Both are valid, but they answer different questions.
The CME Globex session for ES and NQ starts at 18:00 New York time and runs almost around the clock. The regular trading hours (RTH) session of the underlying cash market starts at 9:30 New York time. A VWAP anchored at 18:00 includes the overnight auction; one anchored at 9:30 measures only the cash session.
| Anchor | Includes | Useful for |
|---|---|---|
| Globex open (18:00 New York) | Overnight and cash session | Traders who trade overnight or want one continuous reference |
| RTH open (9:30 New York) | Cash session only | Day traders focused on the New York session |
| Weekly | All sessions since the week's open | Swing context and a larger reference |
| Anchored to an event | Volume since a chosen bar | Judging who is in profit since a specific high, low or release |
Whichever anchor you choose, use it consistently. Mixing anchors makes sessions impossible to compare.
What do VWAP standard deviation bands show?
How far price has moved from VWAP relative to the volume-weighted dispersion of the session.
The bands are calculated from the volume-weighted variance of price around VWAP and are usually plotted at one, two and sometimes three standard deviations. They adapt to the session: tight on a quiet day, wide on a volatile one.
- Inside the first band: price is close to the session average, and rotation is common.
- Between the first and second band: price is extended but still within the session's typical dispersion.
- Beyond the second band: price is stretched relative to the session. Some traders look for responsive activity there, others read it as the strength of a trend day.
Neither reading is automatically right. On a balanced day, a move to the second band often rotates back. On a trend day, price can ride the first band for hours. The order flow at the band tells you which day you are having: absorption at the band supports a rotation, continued aggression with acceptance supports the trend.
How do futures traders use VWAP in practice?
Mainly as a reference for who is in control and where responsive traders may act.
- Trend filter: a session that holds above a rising VWAP is being accepted higher.
- Pullback reference: in a trend, the first return to VWAP tests whether the trend is still supported.
- Mean reversion: in balanced sessions, extensions to the bands often rotate back toward VWAP.
- Execution benchmark: larger participants measure execution quality against VWAP, which is one reason it attracts volume.
VWAP combines well with volume profile. When VWAP sits near the developing POC, the session is balanced. When the two separate, the market is trending, and VWAP lags behind price.
What is anchored VWAP?
Anchored VWAP starts the calculation at a bar you choose rather than at a session boundary. Anchored at a major swing low, it shows the average price of everyone who bought since that low. If price falls back below it, the average buyer since the low is under water, which often changes how that group behaves.
Where does VWAP fit in the PFT tools?
VWAP is one of the sixteen factors the PFT Market Matrix weighs when it forms its bias read, alongside value area and session delta. The read does not replace looking at VWAP on the chart, but it puts VWAP in context with the other factors, so that a single line is not over-weighted.
On the chart itself, the most useful habit is simple: note before the open where VWAP and its bands sit relative to the prior day's value area and the overnight range. When several of those references cluster near one price, that price deserves attention when the market reaches it, and the order flow there is worth reading closely.
FAQ
Is VWAP support and resistance?
It is a reference where behavior often changes, because many participants watch it. It is not a barrier; price can cross it repeatedly on balanced days.
Why does my VWAP differ from someone else's?
Usually because of a different anchor, such as Globex versus RTH open, or a bar-based versus tick-based calculation.
Is VWAP useful on NQ as well as ES?
Yes. The calculation is identical. NQ covers more points per move, so its bands are wider in points; compare distances in standard deviations rather than in points.
What is the difference between VWAP and a moving average?
A moving average weights prices by time and rolls forward. VWAP weights prices by volume and accumulates from a fixed start, so it reflects where volume actually traded in the session.
This article is educational content, not financial advice.