

ATAS Expected Move: Options Chain vs. Options X-Ray Explained
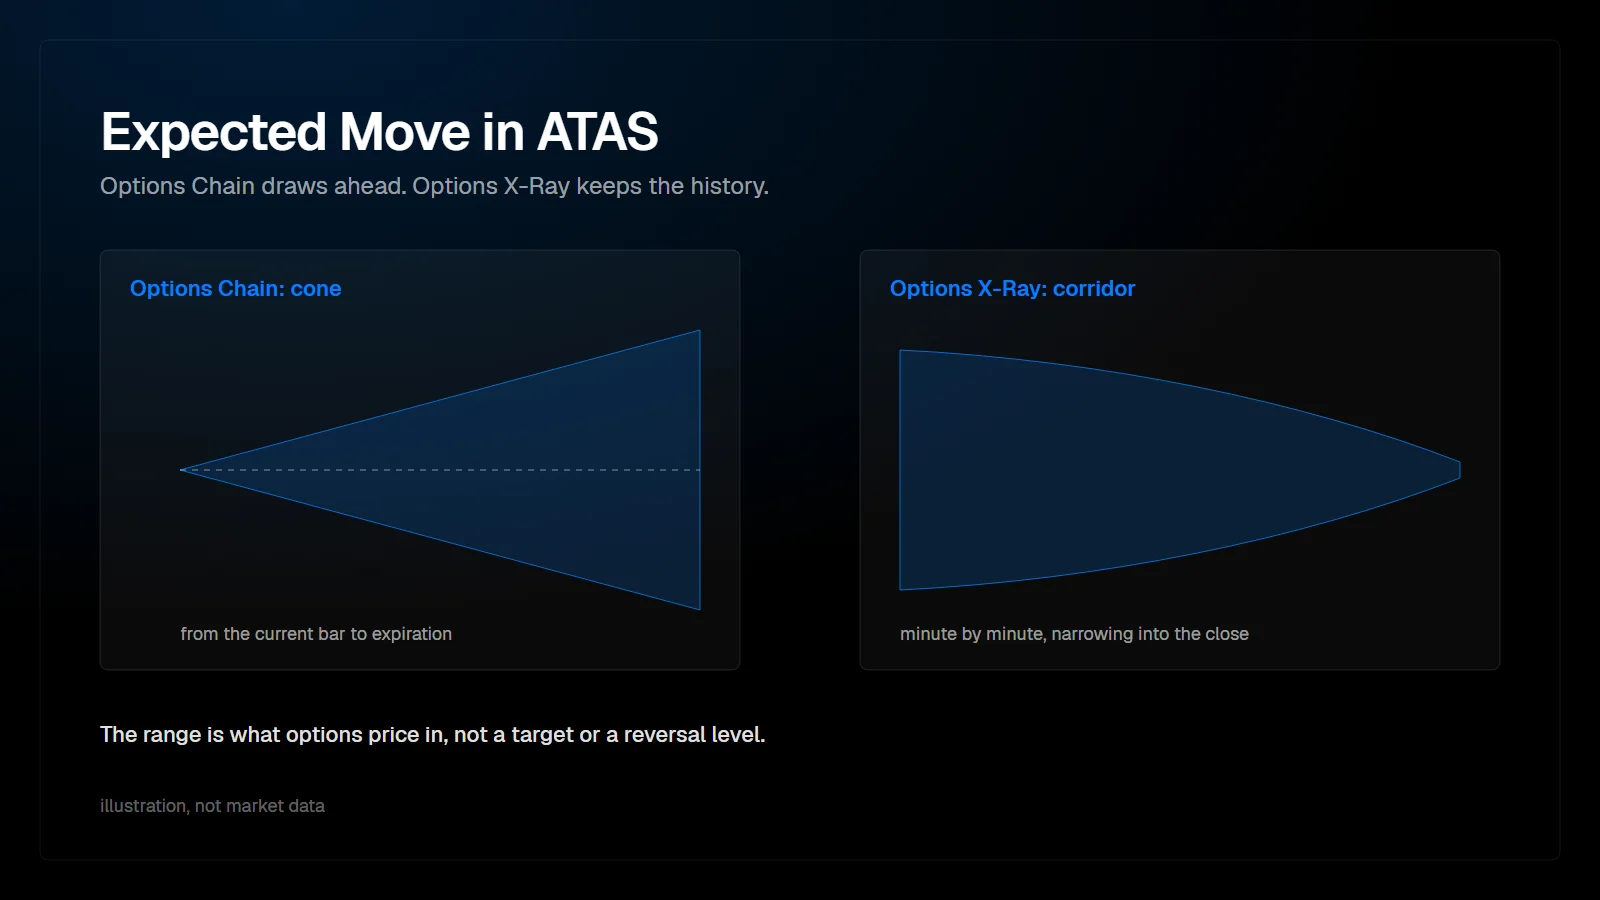
ATAS has two Expected Move indicators. Options Chain: Expected Move derives implied volatility from live option quotes on your connection and draws a cone or corridor from the current bar to expiration, on any instrument with options data. Options X-Ray: Expected Move uses SPX data, recalculates every minute and keeps its history, but runs only on ES, MES, SPY and US 500.
What is the expected move?
The range the options market prices in until a given expiration, derived from what traders pay for options.
The more movement participants expect, the more expensive options become. Working backwards from option prices gives an implied volatility, and from that a range in points. ATAS reads one standard deviation as the range where the options market expects price to stay with roughly 68% probability, and two standard deviations as roughly 95%. These are the market's estimates, not a guarantee, and ATAS says so itself.
How does Options Chain: Expected Move calculate the range?
From implied volatility of live quotes around the current price, for the time remaining until the selected expiration.
If implied volatility is not available, the indicator can fall back to the price of the at-the-money straddle. The status chip shows which of the two methods produced the value, which is worth checking: a straddle-based range and an IV-based range are close in normal conditions but not identical. A label such as EM ±42.50 · 0.74% means the market prices about 42.50 points in either direction by expiration.
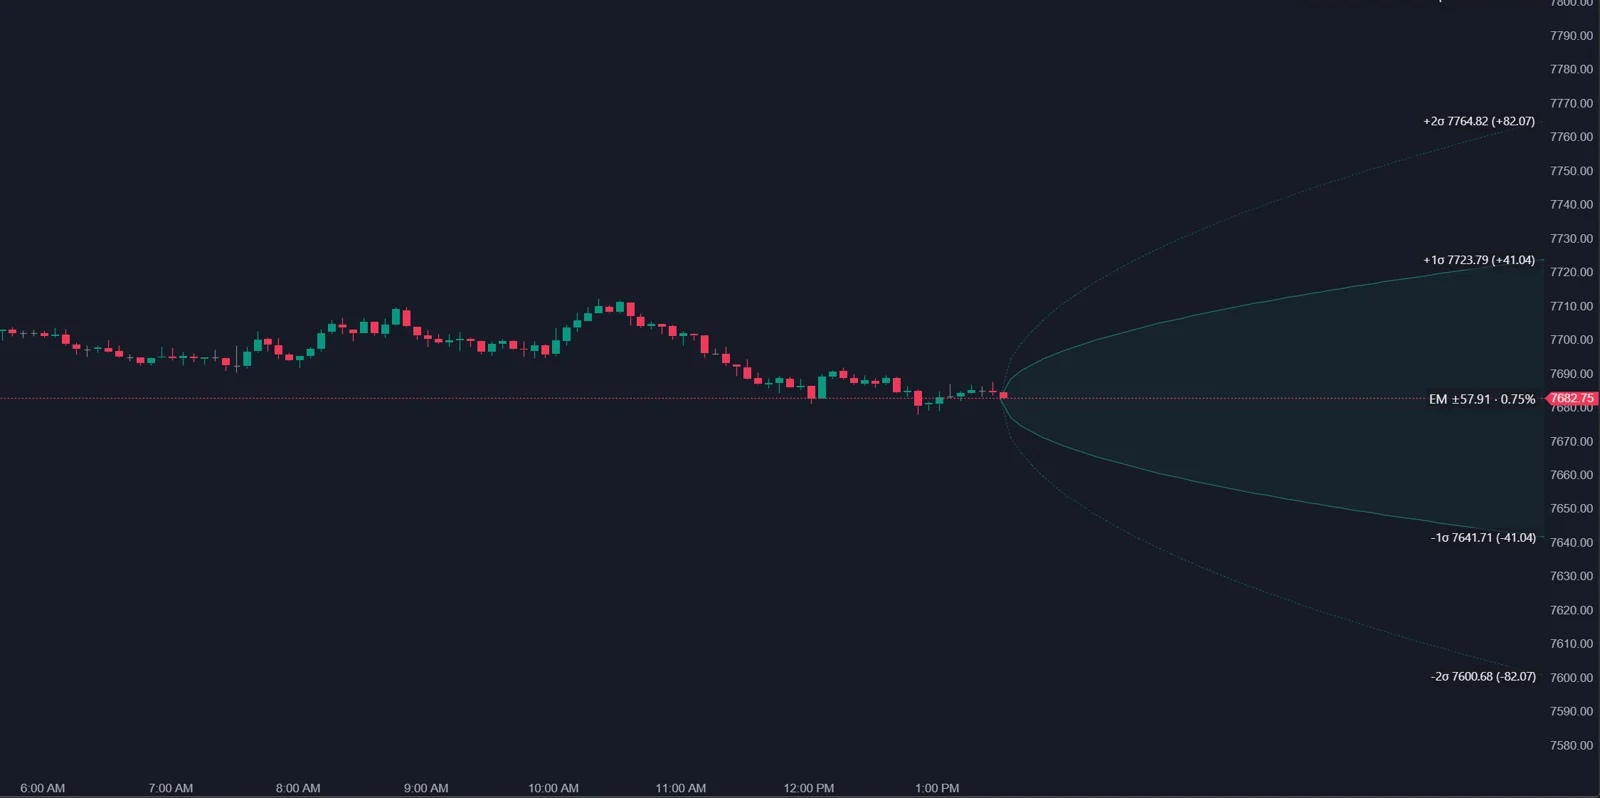
From practice: in the author's own setup in October 2026, the Options Chain indicators run in ATAS X and receive CME E-mini S&P 500 (ES) options through a Rithmic connection. This is the author's experience, not a statement from ATAS.
| Setting | What it does |
|---|---|
| Expiration, Strikes per side | Which series and which strikes feed the calculation |
| Style | Cone widens toward expiration; Corridor draws a flat full range |
| Anchor | Current Price follows the market; Attachment Price stays at the price when the indicator was added |
| First and second sigma multiple | Width of the inner and outer boundaries |
| Band color, boundary color, labels | Appearance |
How is Options X-Ray: Expected Move different?
It is drawn across the whole session, minute by minute, so you can see how the priced range changed.
| Options Chain: Expected Move | Options X-Ray: Expected Move | |
|---|---|---|
| Data | Option quotes from your connection | OptionsDepth analytics derived from Cboe SPX data |
| Instruments | ES, NQ, CL, GC and other CME futures | ES, MES, SPY and US 500 |
| Update | Current quotes, one corridor from the current bar to the right | Once per minute, with history |
| Series | Any available expiration | 0DTE (default) or next expiry |
| Bands | First and second sigma multiple | Band width 1.0 sigma by default, second band off by default |
| Extra | Cone or corridor, anchor choice | Horizon in minutes instead of until expiration |
Comparison from the ATAS help articles on both indicators.
The X-Ray corridor ends exactly at the expiration time of the selected series: 16:00 New York time for weekly and daily options, 09:15 for the morning monthly series, and 13:00 on shortened holiday sessions. On the third Friday of the month, the morning monthly series can expire first and the indicator then switches to the weekly series, so a sharp change that morning is expected.
Why does the range narrow during a 0DTE session?
Because less time is left. For options expiring today, the expected move shrinks with the remaining time and converges toward price at expiration. ATAS notes the narrowing is not linear: slower in the morning, faster near the close. The range can also narrow after important news, when implied volatility drops. This is also why a daily expected move from an external service can look wider than the ATAS cone: one may refer to a full trading day, the other to the time that is left.
How do I use the expected move on the chart?
- At the open, note the width. A wide range means the market prices stronger movement; a narrow one a calmer day.
- Check where price sits: near the middle or already close to a boundary.
- Before scheduled news, watch whether the X-Ray corridor widens.
- Near a boundary, do not fade automatically. ATAS calls the boundary context, not a reversal signal.
- Use it to judge targets: a target outside the 1-sigma range asks for a move the market does not expect on an average day.
In order flow terms, the boundary is a place to read the footprint, not a level to trade blindly. A push into the boundary with fading delta and absorption is different from a push with strong initiative and expanding volume. The second case is the unusual day the range does not cover.
FAQ
Which Expected Move should I use on ES?
If you have the X-Ray package, the X-Ray version shows how the range developed during the day. Without it, or on any other market, use the Options Chain version.
Why does my expected move differ from another website?
Different data, update times, volatility methods and time horizons. A full-day figure and a remaining-time figure differ by design.
Does a move outside the range mean a reversal is due?
No. It means price moved more than the options market priced in. It says nothing certain about the next move.
Can I see how wide the range was this morning?
With Options X-Ray: Expected Move, yes, because it keeps its history. Options Chain: Expected Move only draws the current range.
This article is educational content, not financial advice.