

ATAS Options Data Feed and Open Interest: What the Indicators Really Read
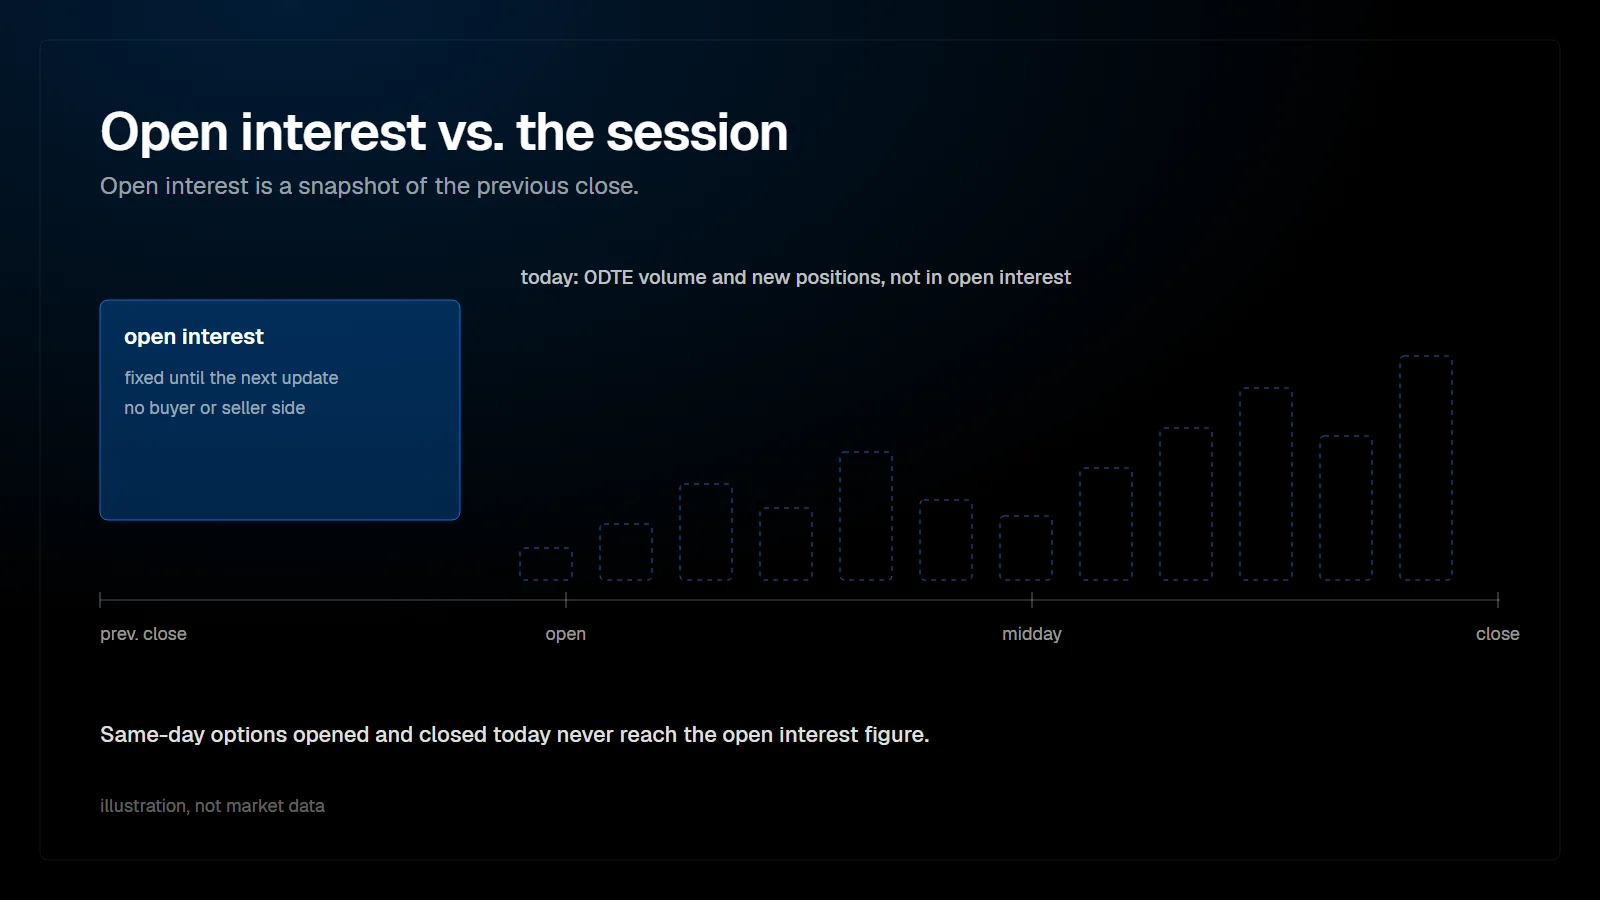
The ATAS Options Chain tools need options data from your own connection, which ATAS names as Interactive Brokers or Rithmic. They read bid, ask, last, open interest and day volume per contract and calculate implied volatility and Greeks themselves. Options X-Ray needs no options feed. The main weakness of the Chain tools is open interest: it updates once per day and does not say who holds which side.
Which data feed do the Options Chain tools need?
A connection that supports options and delivers options data for the instrument on your chart.
ATAS writes that options data can be available through Interactive Brokers or Rithmic, depending on your setup, and that availability depends on the provider, account permissions, the instrument and the market data subscription. The Option Board help article states it more directly: Rithmic or Interactive Brokers is required for the connection. In the changelog of 2 October 2026, ATAS adds that support for CQG, Bybit and Binance is in development.
From practice: in the author's own setup in October 2026, the Options Chain indicators receive CME E-mini S&P 500 (ES) options through a Rithmic connection, and both the Options Chain and the Options X-Ray suites run in ATAS X. ATAS's help articles do not name the option product or the platform version, so this is the author's experience, not an ATAS statement.
Whether options data is included depends on your market data subscription with the provider. Check with the provider before you assume that a prop firm data feed includes options.
Which values does ATAS read, and which does it calculate?
The indicators subscribe to a range of strikes around the current price for the selected expiration. Per contract, ATAS receives live bid, ask, last price, open interest and day volume. Everything else is calculated in ATAS.
| Value | Where it comes from | Used for |
|---|---|---|
| Bid, ask, last | Your connection, live | Implied volatility, Expected Move, Option Board |
| Open interest | Your connection, once per day | Walls, zero gamma, max pain, OI Profile |
| Day volume | Your connection, live | Day Volume mode, volume levels |
| Implied volatility | Calculated in ATAS from option prices | Greeks, Expected Move |
| Delta, gamma and other Greeks | Calculated in ATAS | GEX Profile, tooltips |
| GEX per strike | Calculated from gamma, position size, contract multiplier and underlying price | GEX bars in dollars per 1% move |
The hover tooltip of the OI Profile shows several of these values side by side for one strike: open interest and day volume from the feed, implied volatility and delta calculated in ATAS.
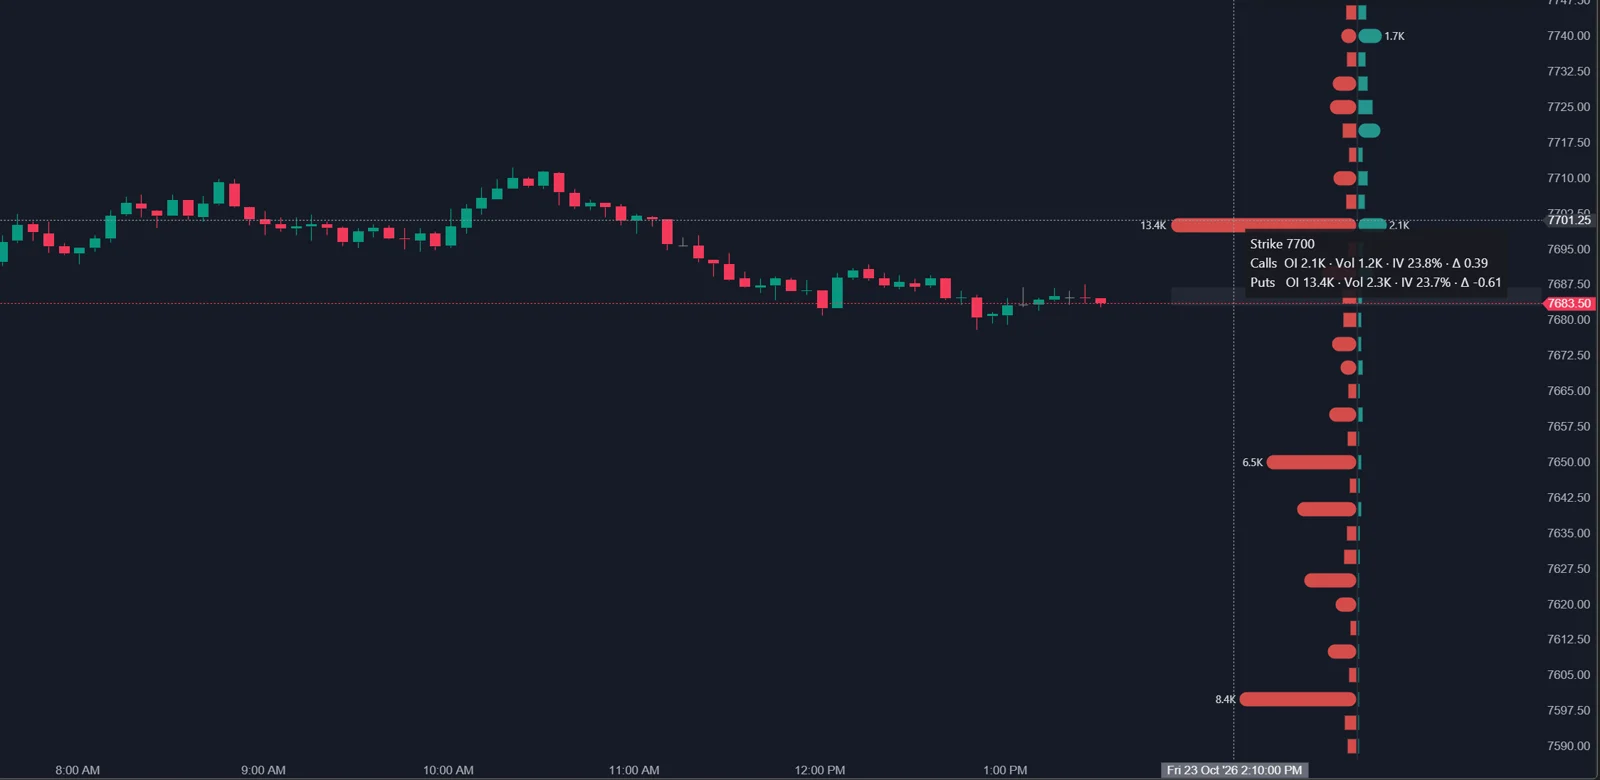
The ATAS help articles do not name the option pricing model, the interest rate or an exact GEX formula. It lists the inputs and the unit, and says calls and puts use the standard sign convention. Treat the numbers as ATAS's own calculation, not as a figure you can reproduce one to one in a spreadsheet.
What does Options X-Ray need?
No options feed. According to ATAS, the X-Ray data is OptionsDepth analytics derived from Cboe market data for SPX options, delivered with the package. The chart needs a connection to any quote source, and delayed data works too. It runs only on ES, MES, SPY and US 500 charts, updates once per minute, and SPX options data is available from about 04:00 to 16:00 New York time. To map index levels onto your chart, the indicators need enough chart history; if they do not have it, the status line mentions calibration.
What do the warm-up and the status chip mean?
Each Options Chain indicator subscribes to many contracts, and the number it can subscribe to is limited by a quote budget. The status chip in the chart corner tells you what is happening.
| Status chip | Meaning |
|---|---|
| 28 Jul · 1 DTE · 238 opts | Working: expiration, days to expiration, number of subscribed contracts |
| warming 12/238 | Still collecting quotes for the subscribed contracts |
| Waiting for options connection | No options-capable connection is available |
| ±19 strikes (3 series share the quote budget) | The strike window was reduced because several expirations share the budget |
Examples quoted from the ATAS help article on option analytics indicators.
What are the five open interest problems to know?
Open interest is the number of contracts still open at the end of a session. It is a solid count, but five properties change what the levels built on it can tell you.
1. It updates once per day
ATAS states that open interest in the Options Chain set updates once per day, and that it can update less frequently than price or day volume. It describes positions at the previous close. Everything opened or closed today is missing until the next update, which is why ATAS says that who bought, who sold and what changed during the session has to be estimated.
2. It does not say who is long or short
One open contract always has a buyer and a seller. Open interest counts the contract, not the sides. A GEX profile therefore needs an assumption about which side dealers hold, and ATAS describes its Chain GEX Profile as estimating market maker gamma from daily open interest under the assumption that clients behave in a typical way. The common version of that assumption has dealers long the calls and short the puts. Academic work that estimates market maker positions in SPX options from Cboe participant data, for example Adams, Dim, Eraker, Fontaine, Ornthanalai and Vilkov (2026), found market maker net gamma positive in 88% of 10-minute intervals in their sample. That does not make every open interest profile wrong, but it is a reason to treat a deep negative gamma reading as a model result rather than a fact.
3. Same-day options never reach open interest
A 0DTE option bought in the morning and sold in the afternoon never appears in any open interest figure. On days with heavy same-day trading, the morning profile describes yesterday's book. The Day Volume mode helps to see where today's trading happens, but volume has no direction: it counts contracts bought and sold, opened and closed, alike.
4. A missing strike is not a zero
The calculation only includes strikes inside the subscribed window. With Wide range (sparse) on, ATAS subscribes to every second strike, and the skipped strikes are not subscribed at all, so strike-by-strike detail becomes approximate. If the chain delivers no open interest, the Max Pain line is not drawn. Read an empty strike as unknown, not as no position, and widen the window before you conclude that a level has no support behind it.
5. Other services use other inputs
ATAS lists the reasons its values differ from other services: data sources, expiration filters, strike ranges, open interest update timing, implied volatility methods, gamma models and index-to-futures mapping rules. Services that build levels from SPX or SPY options and shift them to ES start from a different options pool than Options Chain on an ES chart, which reads the options your connection delivers for that instrument. A different number is usually a different method, not an error.
What should I check when the options indicators show nothing?
- The connection: is the options-capable connection (Interactive Brokers or Rithmic) the one feeding this chart?
- The permission: is the options market data subscription for this exchange active?
- The expiration: does the selected expiration still have contracts? Auto (nearest) switches after expiration.
- The status chip: is it still warming up, or waiting for an options connection?
- For Options X-Ray: is it an ES, MES, SPY or US 500 chart, and is the package enabled in your account?
FAQ
Does a prop firm Rithmic login include options data?
Not necessarily. Options data depends on the account permissions and market data subscription behind the login. If the status chip waits for an options connection, ask the provider whether options data is enabled.
Does ATAS calculate gamma itself?
Yes for Options Chain. ATAS calculates implied volatility and Greeks from the option prices it receives. For Options X-Ray, the values come with the OptionsDepth analytics.
Why did my levels jump overnight?
Open interest updates once per day, and an expiration can remove a large part of the book. Both change walls, zero gamma and max pain from one session to the next.
Is Day Volume a replacement for open interest?
No. It shows where trading happens today, but not whether contracts were opened or closed, or by which side. In the GEX Profile, walls and zero gamma stay based on open interest even when the bars use Day Volume.
This article is educational content, not financial advice.