

How to Set Up Order Flow Tools in ATAS
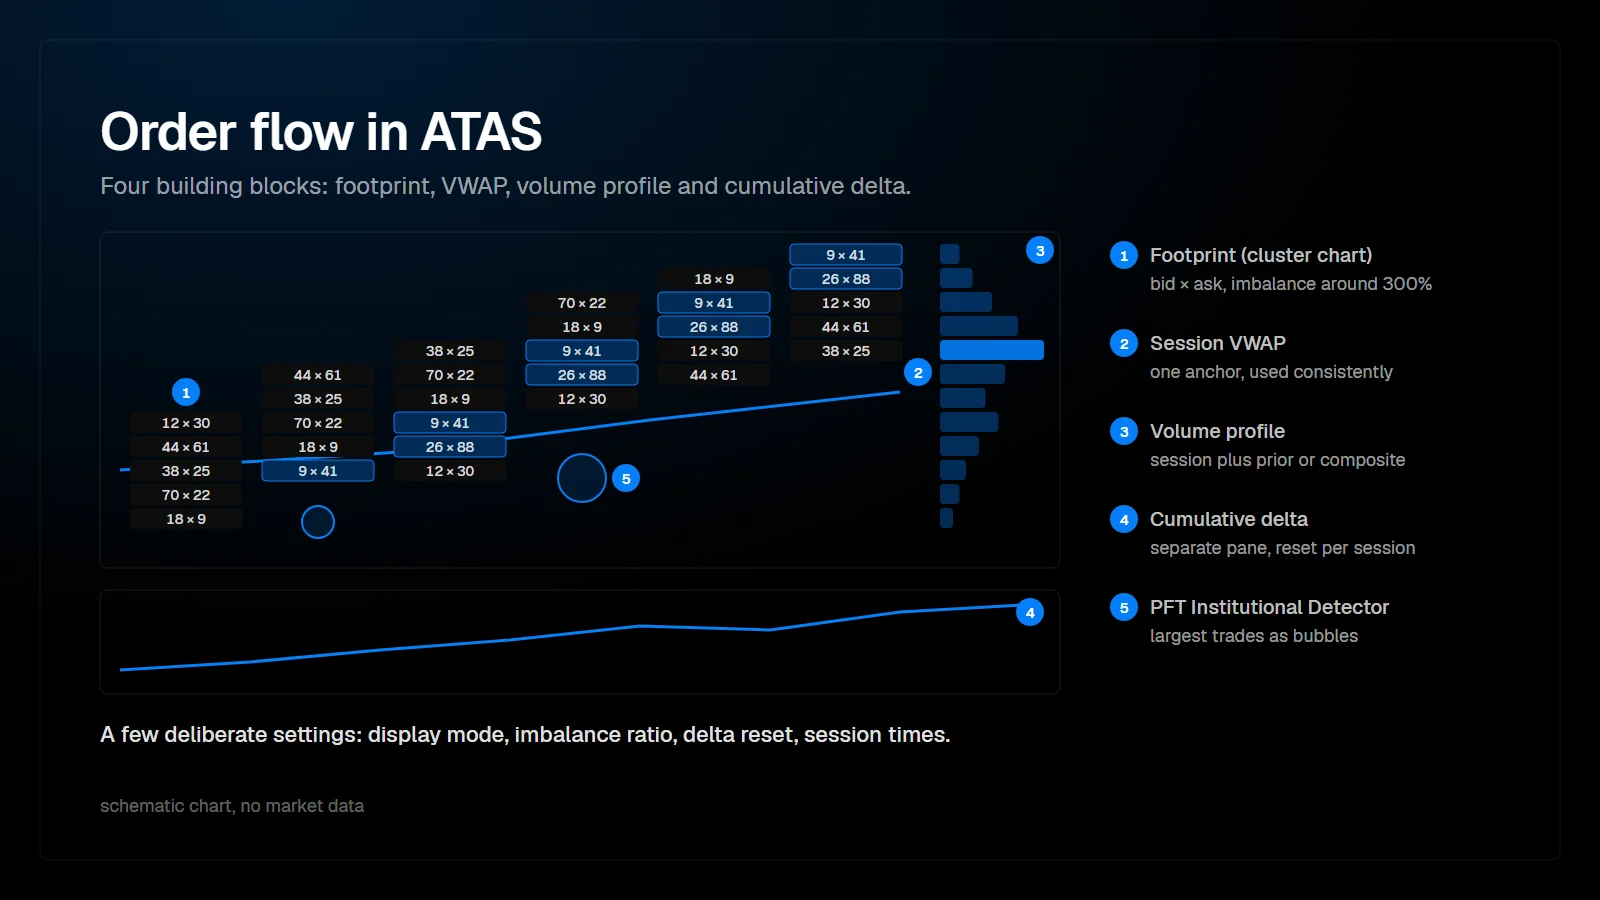
Setting up order flow in ATAS takes four building blocks: a footprint chart in cluster mode, a cumulative delta pane, a volume profile and a session VWAP. Each needs only a few deliberate settings, mainly the display mode, the imbalance ratio, the delta reset and the session times. Everything else can stay at defaults until you know what you need.
What do you need before setting up ATAS?
A futures data feed with tick-by-tick trades, ideally with market depth.
Footprint, delta and profile all depend on individual trades with their aggressor side. For CME futures such as ES and NQ, feeds connected through a futures broker or data provider supply this. Market depth adds the DOM. Without tick data, the footprint cannot split volume into bid and ask.
- A connection to a CME data feed with tick data and, for the DOM, depth.
- The instrument loaded on its front month.
- Enough history loaded for the profile periods you want, for example several sessions for a composite profile.
- Time zone and session times set, so sessions start where you expect.
ATAS exists as ATAS Classic and as ATAS X. The concepts below apply to both; menu names and layouts can differ between the two.
How do you set up the footprint (cluster) chart?
Switch the chart to cluster mode, choose a display mode, and configure imbalances.
ATAS calls the footprint a cluster chart. In the chart's cluster settings, pick the display that fits the question: bid x ask for aggression, delta for net aggression per price, volume for distribution. Most order flow traders start with bid x ask.
| Setting | Starting point | Why |
|---|---|---|
| Display | Bid x Ask | Shows aggression on both sides at each price |
| Imbalance ratio | Around 300% | Highlights clear dominance without flagging every row |
| Imbalance minimum volume | A filter above the smallest prints | Prevents 3 contracts against 1 from being flagged |
| Price aggregation (ES) | 1 tick per row | ES footprints are readable at full resolution |
| Price aggregation (NQ) | Several ticks per row | NQ covers more ticks per move; grouping keeps bars readable |
| Bar type | Time bars or volume bars | Time bars for comparison, volume bars for even information per bar |
Starting points, to be adjusted per instrument and trading style.
Diagonal imbalances, stacked imbalances and unfinished auctions are explained in the article on footprint charts. Set the chart up so those features are visible, then leave the settings alone long enough to learn what normal looks like.
How do you add cumulative delta?
Add the Cumulative Delta indicator in a separate pane below the price chart and reset it per session.
The reset decides what the line measures. A session reset shows aggression within the current auction. Without a reset, the line depends on how much history is loaded. Candles show intrabar swings of delta; a line is cleaner for reading divergence across swings.
- Pane: separate, below price, on the same time axis.
- Reset: per session, matching the session you trade.
- Display: candles for detail, line for divergence reading.
- Optional: a per-bar delta histogram for single-bar divergences.
How do you add a volume profile?
Add a profile for the current session and, separately, a prior-session or composite profile.
ATAS offers profile indicators that plot volume per price for a chosen period, with point of control and value area. Two profiles cover most needs: the developing session profile, and yesterday's profile or a multi-day composite. Extending the value area high, value area low and POC to the right turns them into references for the whole session.
How do you add a session VWAP?
Add a VWAP anchored to the session you trade, with standard deviation bands.
Decide whether VWAP starts at the Globex open or at the regular trading hours open, and keep that choice consistent. One and two standard deviation bands are enough for most traders. The article on VWAP for futures day trading explains how to read them.
Where do the PFT indicators fit in?
The PFT indicators are an additional context layer on top of this base, not a replacement for it.
| Tool | What it adds to the setup |
|---|---|
| PFT Market Matrix | Weighs sixteen market factors, including VWAP, value area and session delta, into one bias read: balanced, directional or strong |
| PFT Institutional Detector | Marks the largest executed trades as bubbles, shows sweeps, and tags recurring levels as absorption or rejection next to a dollar volume profile |
| PFT Range Matrix | Compares the current range with the average of past sessions, for the full day and separately for Asia, London and New York |
| PFT Correlation Engine | Measures how the chart moves together with a second instrument, such as ES against NQ, on four lookbacks |
| PFT Structure Map | Labels swings and marks breaks of structure and changes of character on a swing and a micro layer |
They are delivered through the ATAS Marketplace: after subscribing, the indicator appears inside ATAS under the trader's account, with no files to copy. Each one answers a single question, and the entry decision stays with the trader.
How do you keep the workspace readable?
- One chart with the footprint at the execution time frame, one higher time frame chart for structure.
- Profiles and VWAP on both charts, delta only where you execute.
- Levels marked before the session, so order flow is read at prices that matter.
- The layout saved as a template, so every session starts with the same settings.
A trading journal closes the loop. The PFT Terminal is free, imports ATAS trades automatically and records MAE and MFE per trade, which makes it possible to review whether the order flow read behind each trade held up.
FAQ
Does ATAS include a footprint and cumulative delta by default?
Yes. The cluster chart and a cumulative delta indicator are part of the platform. Additional indicators, including the PFT tools, add further context on top.
Which imbalance ratio should I set in ATAS?
Start around 300 percent with a minimum volume filter and adjust per instrument. Highlighted imbalances should be rare enough to mean something.
Do the settings differ between ES and NQ?
The concepts are the same, but NQ usually needs more price aggregation per row and different volume filters, because it moves through more ticks with smaller size per tick.
Is market depth required for order flow in ATAS?
For footprint, delta, profile and VWAP, tick data with the aggressor side is enough. Market depth is needed for the DOM and for tools that read resting liquidity.
This article is educational content, not financial advice.