

Every Volume Tool in ATAS X Explained
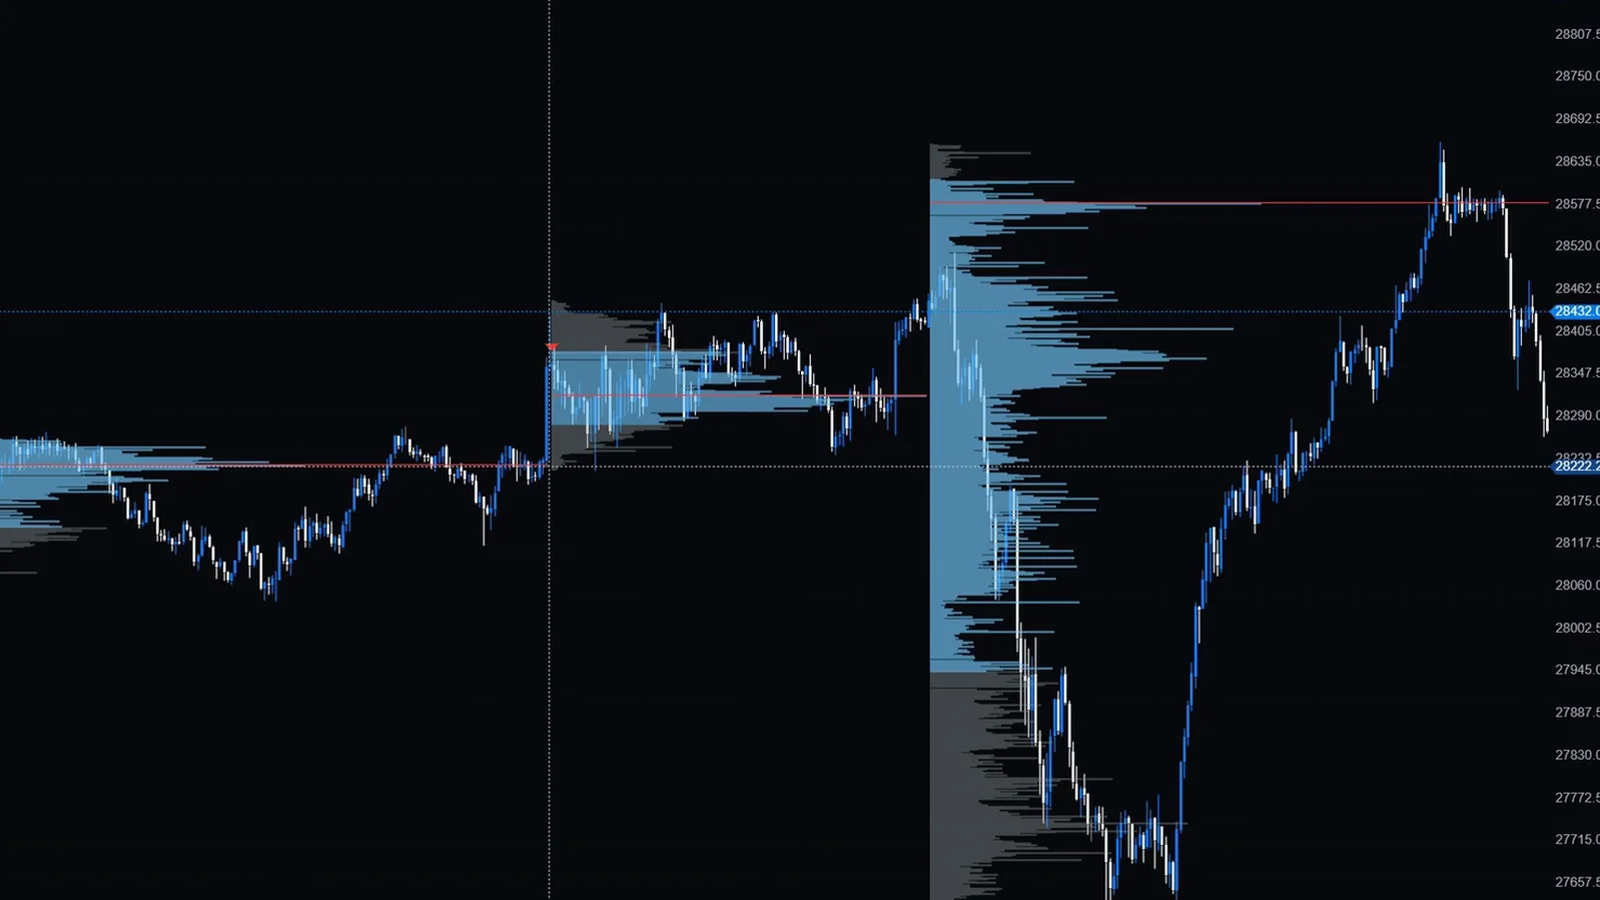
ATAS X ships with volume tools in two places: one Volume Profile and TPO indicator that you add to a chart, and four profile drawing tools (Volume Profile and TPO, Fixed, Anchored and ZigZag) in the drawing toolbar. On top of that come four volume indicators: Volume, Delta, Cumulative Volume Delta and Volume Spread Analysis. This guide goes through all of them in the order of the video, with the settings I use and how I read them.
- Volume Profile and TPO indicator: one profile per period, for example one for extended and one for regular trading hours.
- Four profile drawing tools: Volume Profile and TPO, Fixed, Anchored and ZigZag, each drawn by hand on the chart.
- Volume indicators: Volume, Delta, Cumulative Volume Delta (CVD) and Volume Spread Analysis (VSA).
- Cumulative Daily Volume is also provided, but I see no real edge in it.
How do you set up the Volume Profile and TPO indicator?
Add it from the indicator menu, set the mode to Profile and give it an external period. That is the profile I use every day.
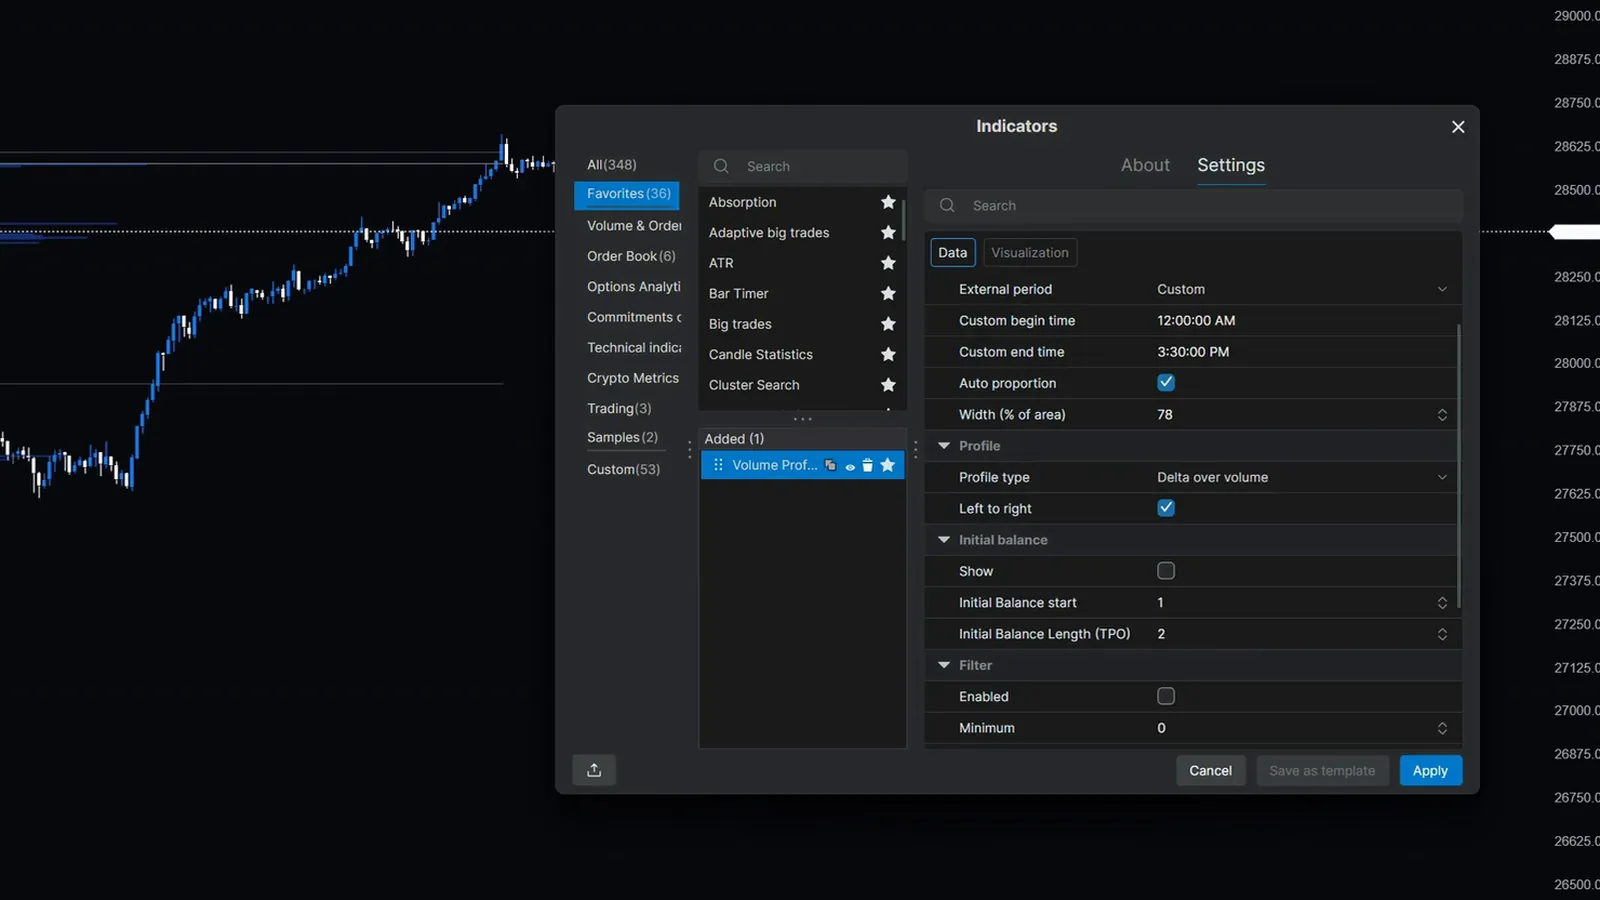
The mode decides what you see: a volume profile, a TPO profile, or the profile drawn over the TPO. I use the profile. The external period sets the time span one profile covers. The daily period is the simplest choice. If you want to see the difference between regular and extended trading hours, you split them into two profiles with a custom period instead.
In the video I run both from Central European time. The extended trading hours profile uses a custom period from 0:00 to 15:30. The regular trading hours profile runs from 15:30 to 22:00. You could also end it at 23:59 and the volume would stay the same. Use the times of your own time zone and session.
| Setting | What I use | Why |
|---|---|---|
| Mode | Profile | Volume profile only, no TPO letters |
| External period | Custom, one profile per session | Separates extended and regular trading hours |
| Auto proportion | On | ATAS scales the profile width; you can change it manually if it looks too big |
| Profile type | Volume | Bid/ask, delta and delta-over-volume types exist, but I stay with plain volume |
| Initial balance | Off | The first 60 minutes of the regular session; only useful for the regular profile |
| Area color | Transparent | Too much color on the chart otherwise |
| Draw above price | On | I want to see it as my regular profile |
| Profile color | Greyish | Keeps the profile quiet next to the candles |
| Value area | Shown as an area in a brighter blue | Highlights where about 70 percent of the volume traded (68 percent, depending on the calculation) |
Settings shown for the Volume Profile and TPO indicator.
The point of control keeps its default line style. You can change its text color, but you will not see the text, because ATAS has no setting for the text size. Click apply and the profile appears.
Duplicating, templates and the scaling tip
- Duplicating a profile did not work in this recording because of an ATAS bug. Add the second indicator and repeat the settings instead.
- At the time of recording, ATAS could not save a template for this indicator. Save your workspace after you have set up all profiles, because a crash can otherwise cost you the whole setup.
- If you add a delta profile next to the volume, ATAS does not aggregate the individual ticks into one point per bar. Turn off Auto scale and enter a value instead. For NQ I like to use 4. The volume becomes less granular and easier to read.
What are the four volume profile drawing tools?
Volume Profile and TPO, Fixed Volume Profile and TPO, Anchored Volume Profile and TPO, and ZigZag Volume Profile and TPO. They sit in the drawing toolbar on the left.
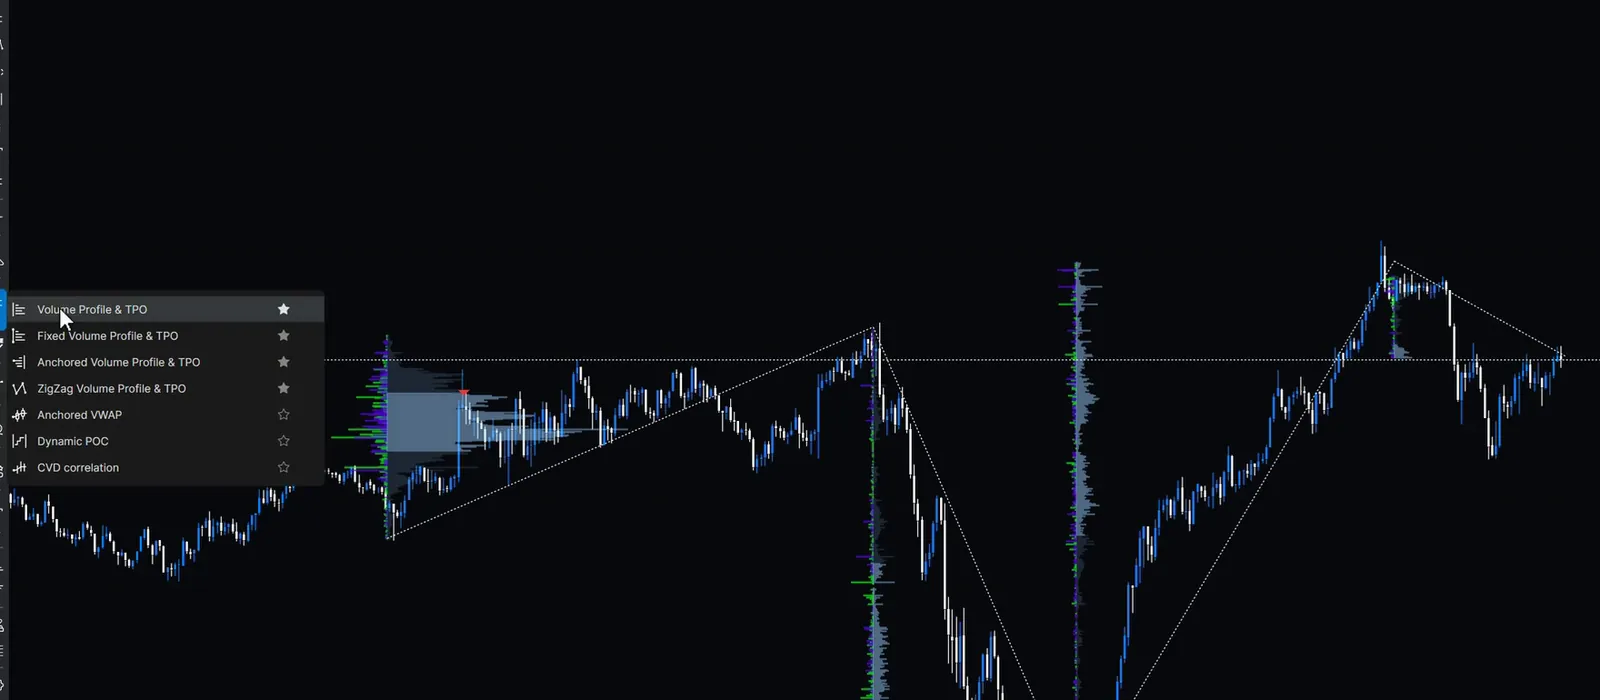
Click the star next to a tool and it becomes a favorite in the drawing toolbar at the upper left of the chart, so it is one click away. Open the settings of any of them by double-clicking its border or by right-clicking it and choosing settings.
Volume Profile and TPO
This is my favorite one. I use it while I am in a trade, while I analyze something and while I manage a position. You pull it out wherever you want on the chart, and everything the price did inside that box shows up in the profile. Hover over a corner to choose whether the profile builds from left to right, which is how I use it, or from right to left. In the settings you find the same options as in the indicator: mode, profile type, colors, point of control and value area.
Fixed Volume Profile and TPO
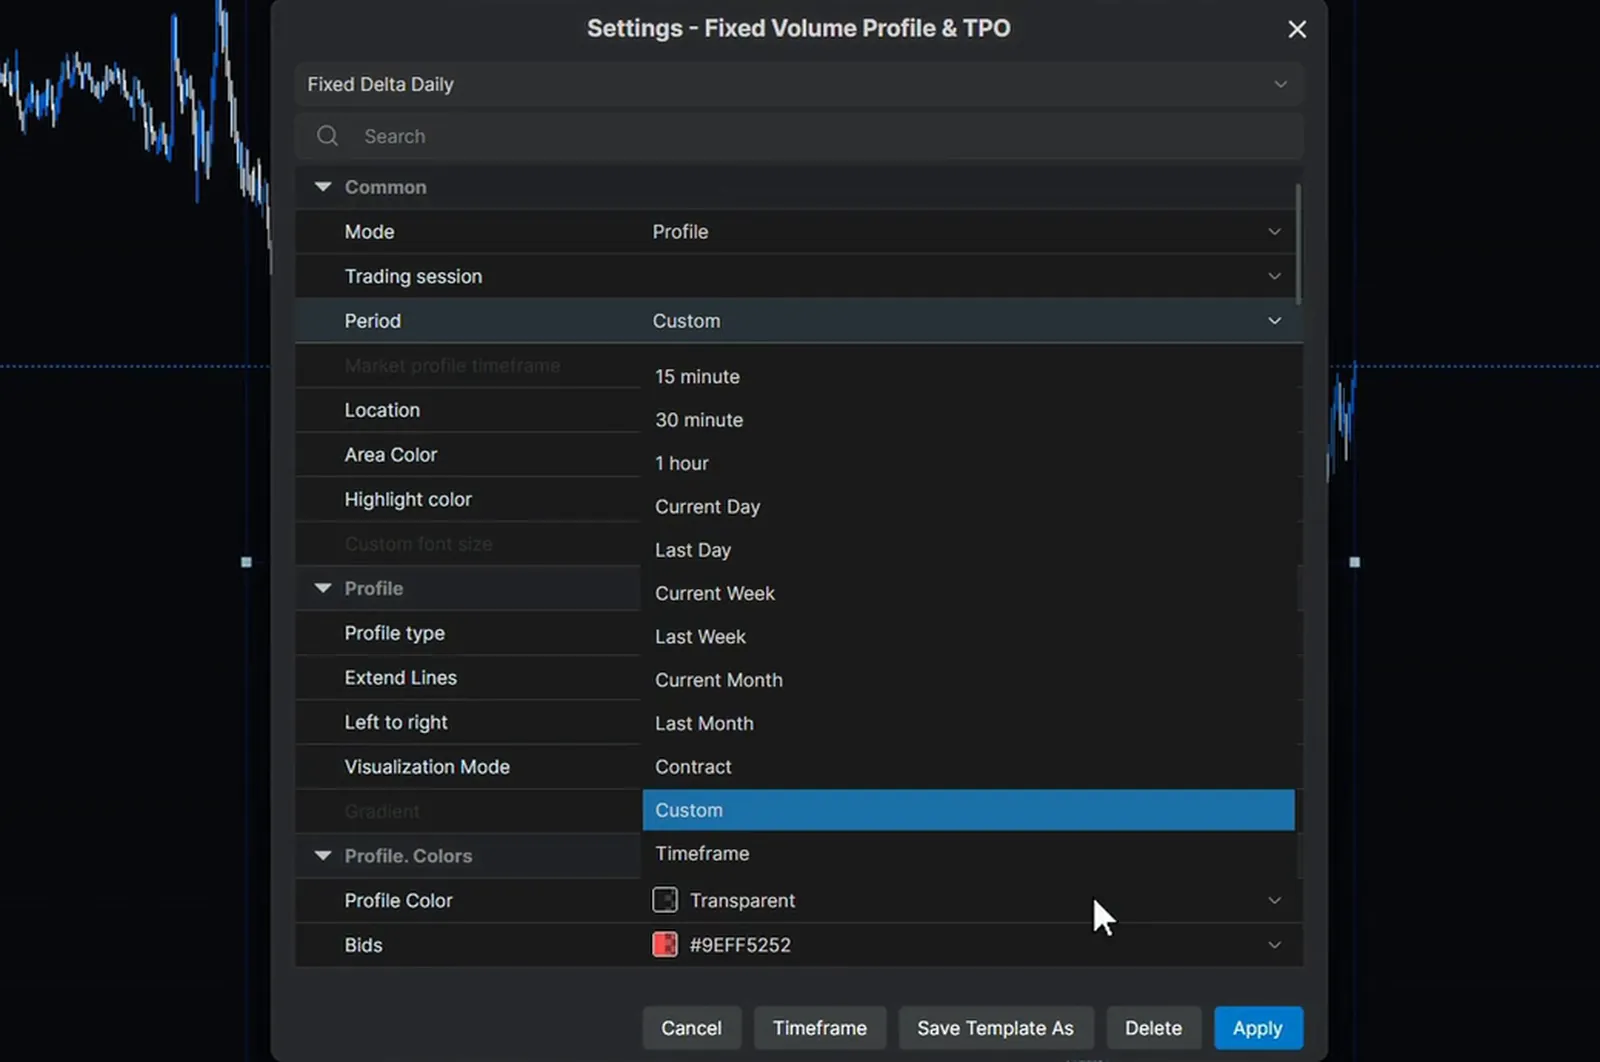
The difference to the first tool is that the fixed profile has a beginning and an end that you can pull wherever you want. Its period is set to custom, but you can also choose a current day, a week or a month, or the contract, as the list in the settings shows. The remaining settings work the same way: change the mode, brighten the profile color, set the point of control and the value area.
Anchored Volume Profile and TPO
The third tool is very similar to the fixed profile. You pull it wherever you want, set the beginning and the end, and change the same settings by double-clicking the border: location, profile type, profile color, point of control and value area. For me it is the third option for volume analysis from the drawing toolbar.
ZigZag Volume Profile and TPO
The fourth and last tool measures a swing instead of a box. Click once with the left mouse button where the first swing begins, click again where it finishes, and add more points for the next swings. A right click ends the drawing and the profile appears. It is useful if you trade breakouts or continuations from one swing to the next and do not want the regular box profile.
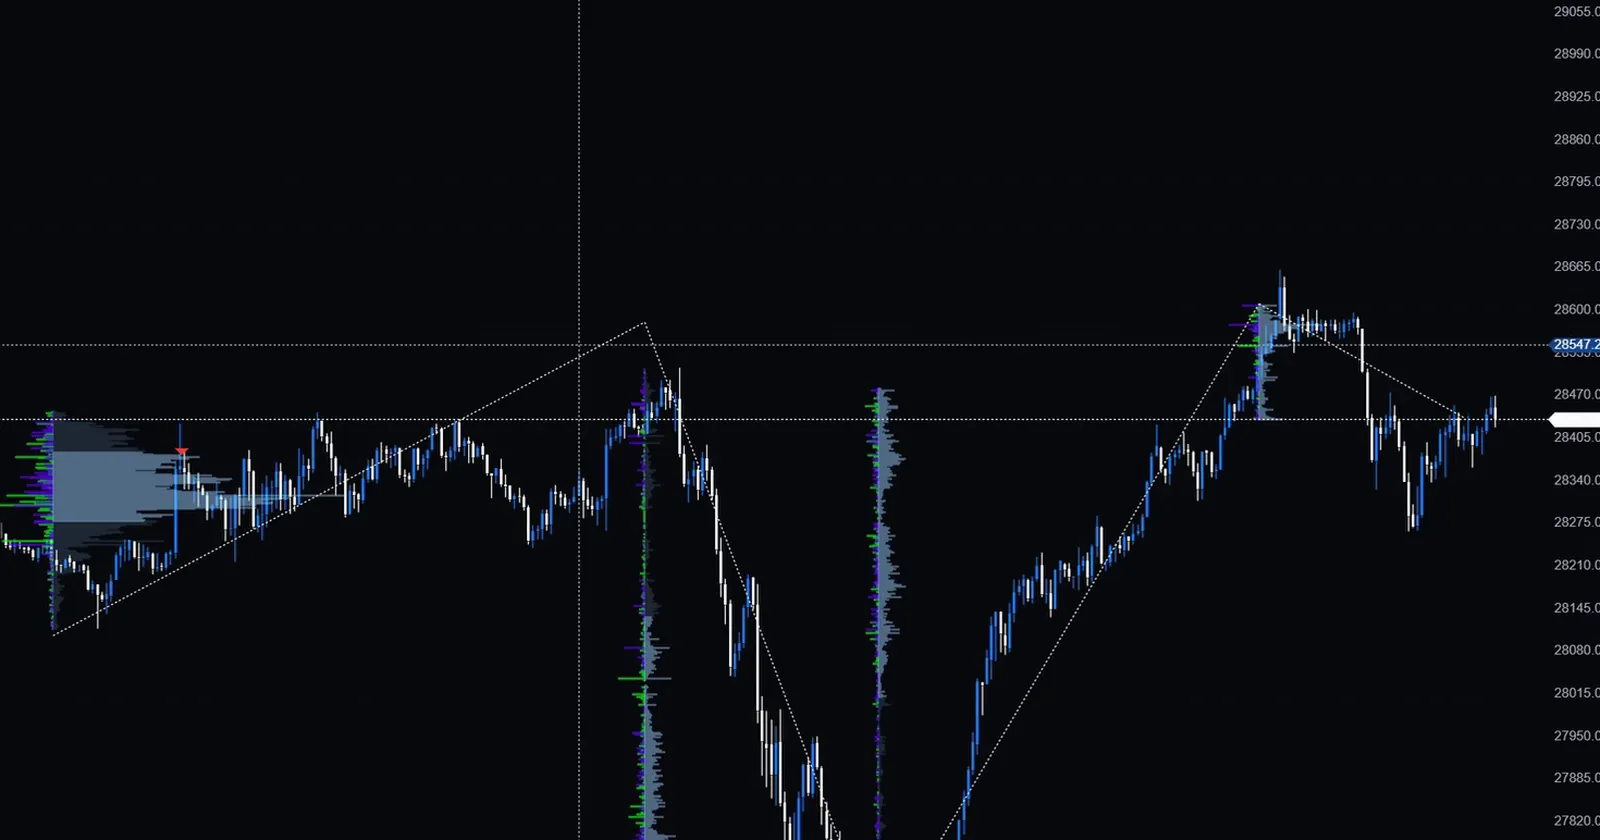
Pull a pin and the profile covers more or less data. To add a point before the first one, click the plus and set the next point, then right click again.
Templates and visibility per time frame
Saving a template did not work for the Volume Profile and TPO indicator, but it works for the four drawing tools. Save a template right after you change something. The time frame setting is also useful: you can switch off the visibility of a drawing on a time frame such as M1. In the video, a profile hidden on M1 stays visible on an M15 chart.
How do you use the Volume indicator?
It shows the total amount of contracts traded, bid and ask together, for each candle. It is enabled by default on most charts.
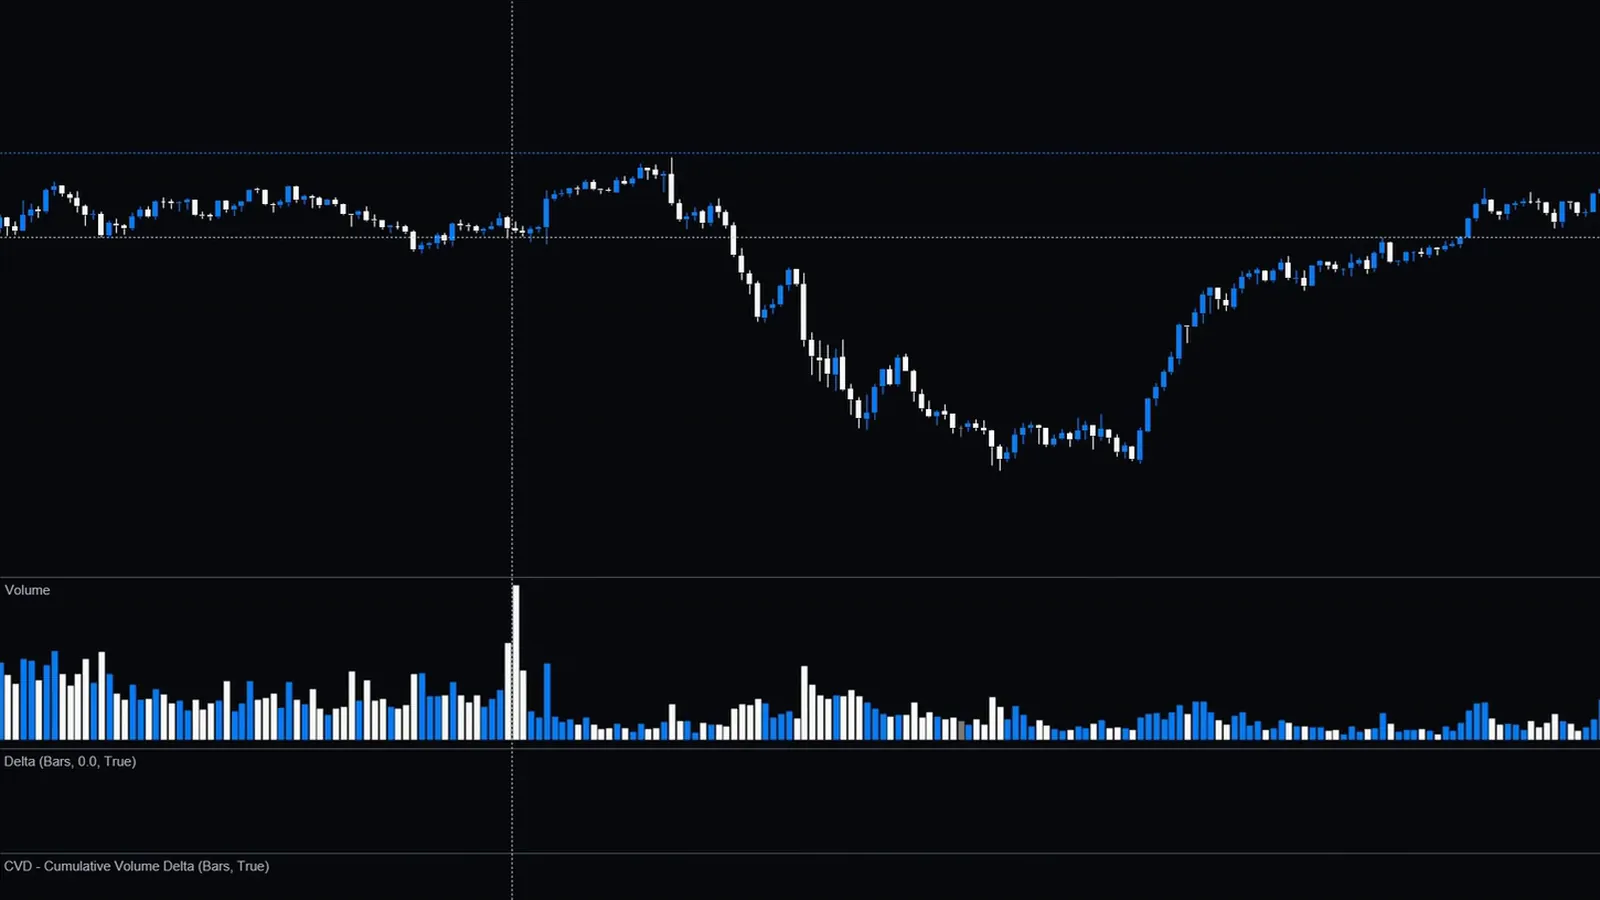
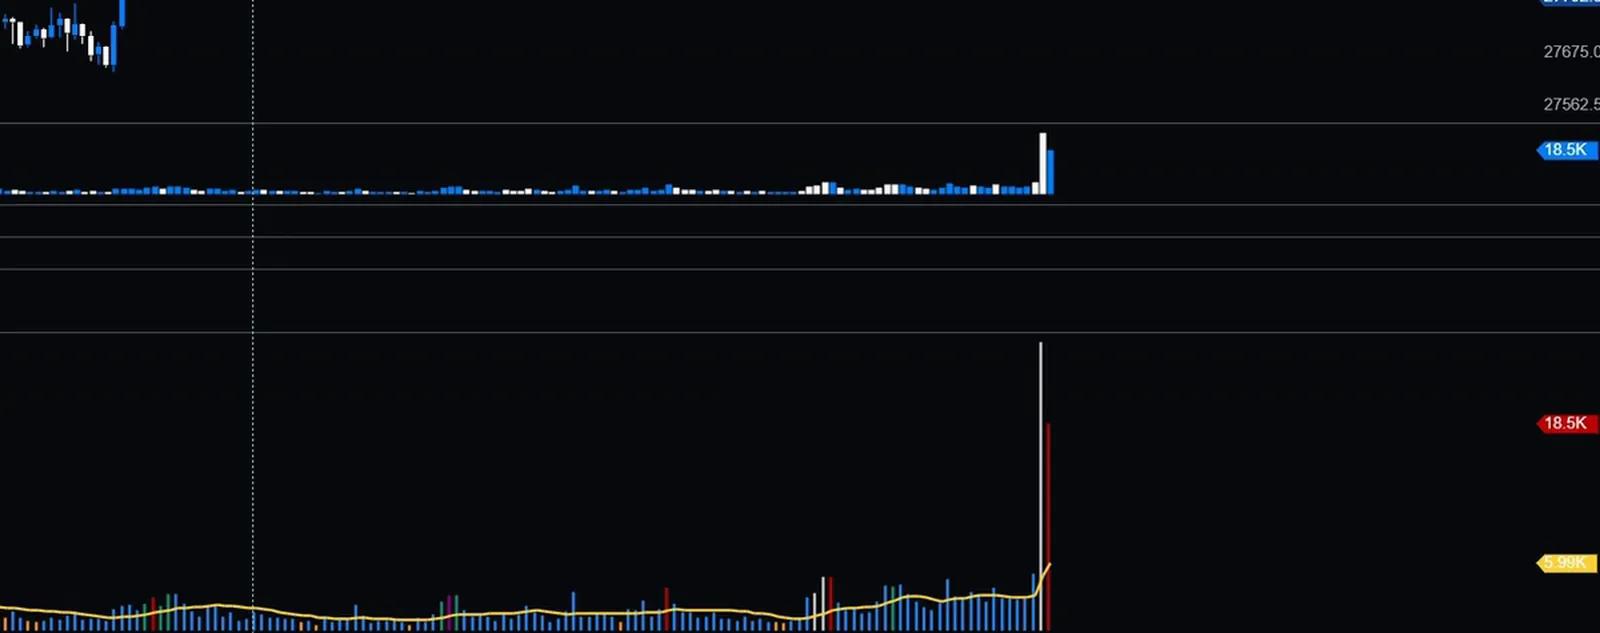
One way to use it is volume spread analysis: you compare how much volume traded with how far the candle moved. If a candle is small, but its volume is a big outlier, the move was not backed by price progress. For me that tells you that passive participants are strong there. The coloring follows the candle: a candle with more selling than buying is colored white. Show description, drawing colors and the other options are in the settings.
What does the Delta indicator show?
Delta is the aggressive buyers minus the aggressive sellers for each candle. If more aggressive buyers than sellers traded, the delta bar points up.
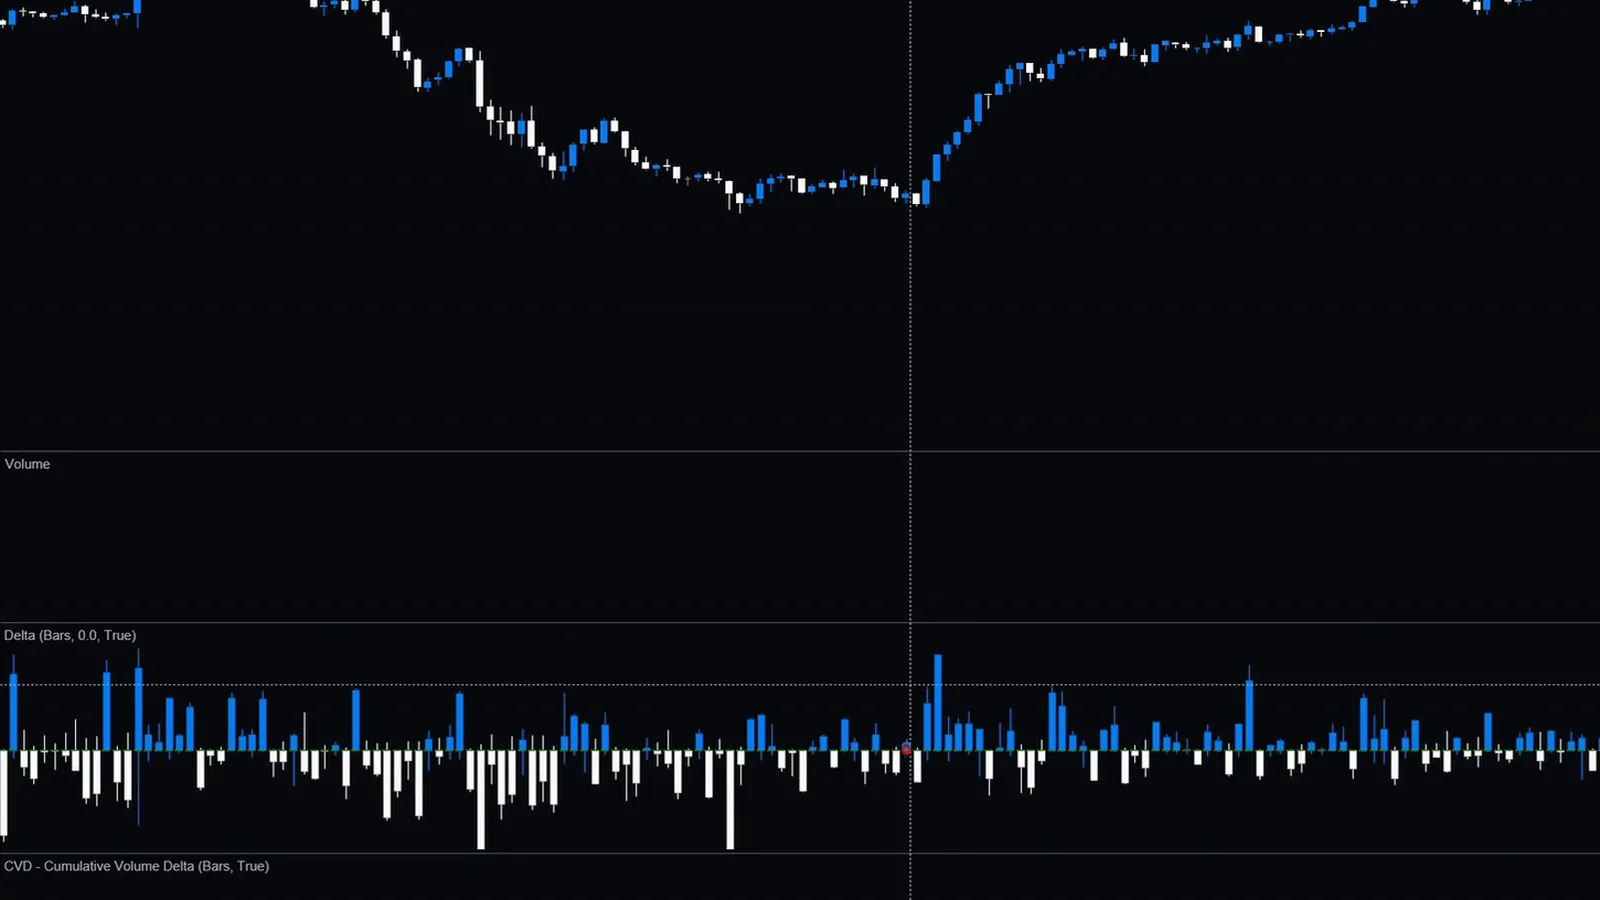
You do not know the total volume from delta alone, but you know the aggression. Use it instead of the cumulative volume delta if you do not want all bars summed into one continuous candle move. It is very good for understanding when absorption happens. If there are heavy delta outliers, for example huge selling in the highs while price goes nowhere, that is likely a sign not to go short there, because passive participants are strong. That is what delta measures.
How do you read Cumulative Volume Delta (CVD)?
CVD is the running sum of the deltas, so it also gives you the history. You open its settings with the three dots at the top of the pane or by right-clicking the indicator.
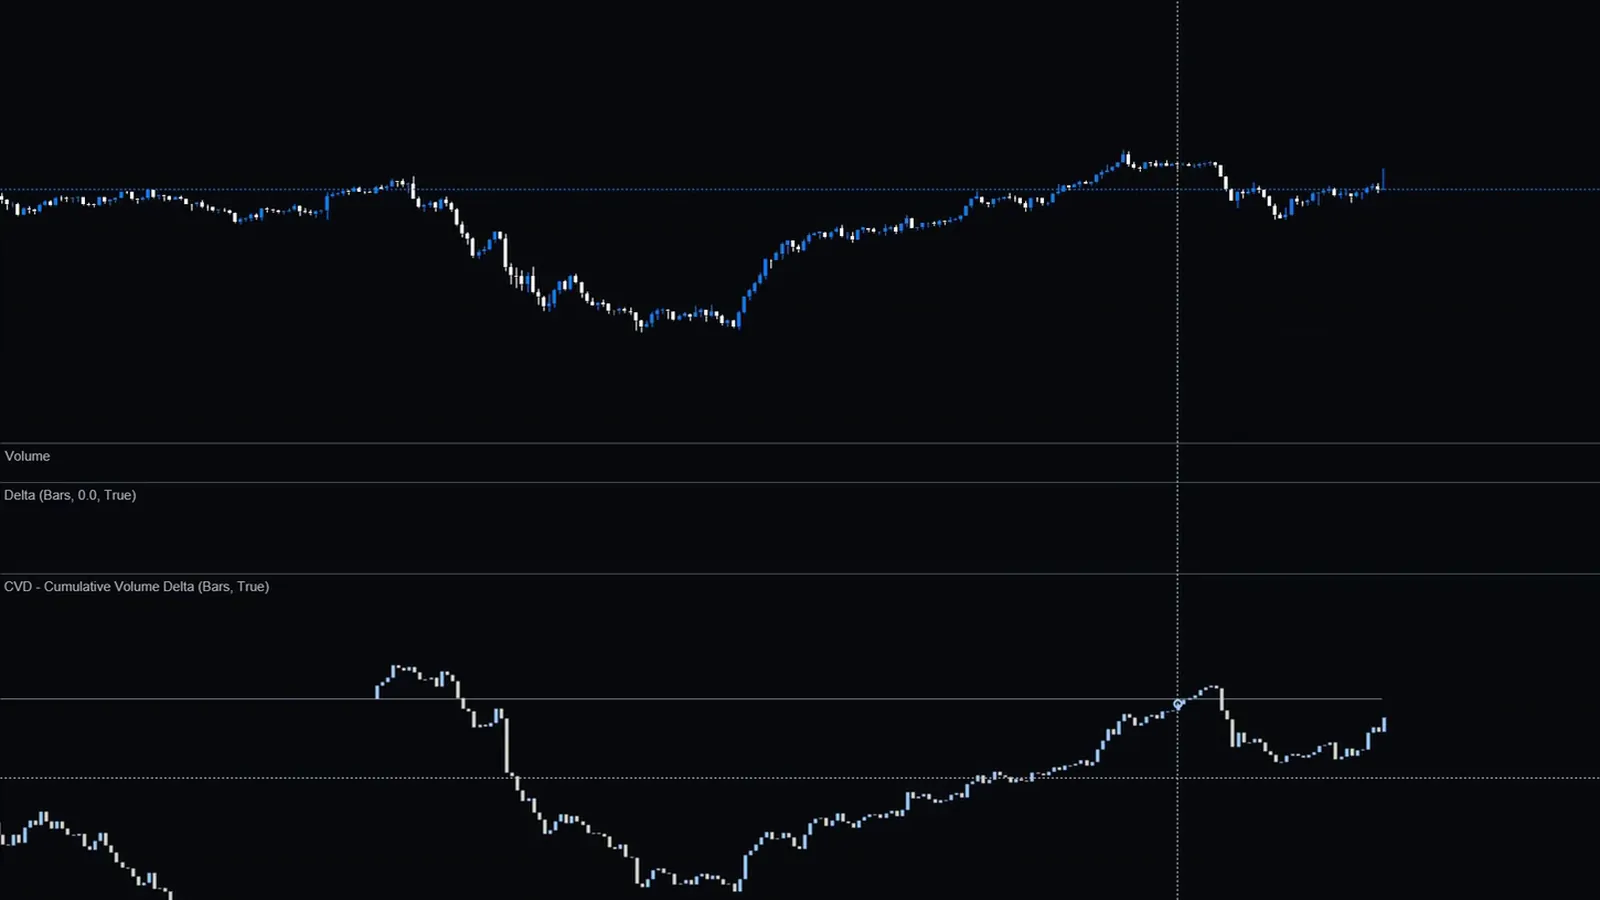
For the visualization, the visual mode can be candles, bars or a line. I change it back to candles. The main use is divergence between the aggressive participants and the passive ones: when price does not follow the aggression, the absorption might be strong, and you can spot good reversals that way. The other direction matters just as much. If price is aligned with delta, the aggressive participants are being rewarded for their effort, and the continuation has the better chance than trying to trade reversals at the lows because you believe in absorption while delta says otherwise.
Cumulative Daily Volume sums the volume of the bars over the day. I do not see any real edge in it and only mention it because ATAS provides it as a volume indicator.
What does the Volume Spread Analysis indicator do?
It marks the volume outliers by color. The period in the video is 14, and the retrospective analysis looks back 20 bars. Bars above the V4 line count as high volume.
| Color | Meaning |
|---|---|
| Red | High volume, bullish candle, big spread |
| White | High volume, bearish candle, big spread |
| Green | High volume, small spread |
| Magenta | Candle group: high volume with a big and a small spread at the same time |
| Yellow | Small tick volume |
Candle colors of the VSA indicator, as explained in the video.
The calculation is based on tick volume, not on the actual traded volume, so keep that in mind when you compare it with the other volume tools.
What should you keep in mind?
- Save your workspace after you set up the volume profile indicator, because it has no template.
- Save a template for each of the four drawing tools as soon as you change them.
- Switch off the visibility of a drawing on time frames where you do not want it.
- Check the time zone of your session times before you copy the extended and regular hours.
- Delta shows the aggression, CVD shows the history, and both are most useful when you compare them with what price actually does.
FAQ
Which volume tools does ATAS X have?
The video covers the Volume Profile and TPO indicator, four profile drawing tools (Volume Profile and TPO, Fixed, Anchored and ZigZag) and the Volume, Delta, Cumulative Volume Delta, Cumulative Daily Volume and Volume Spread Analysis indicators.
Is delta the same as cumulative volume delta?
No. Delta is the aggressive buyers minus the aggressive sellers for one candle. Cumulative volume delta adds those values up over time, so it shows the history of the aggression as one continuous line or candle series.
Can you save a template for the volume profile indicator?
Not at the time of the recording. Save the whole workspace instead. The four profile drawing tools do support templates.
How do you spot absorption with these tools?
Look for large delta outliers or a divergence between CVD and price, where aggressive trading does not move price. In the video this is read as passive participants being strong at that level, and not as a signal on its own.
This article is educational content, not financial advice.