

ATAS Options X-Ray Charm Heatmap: Time Decay Hedging on ES
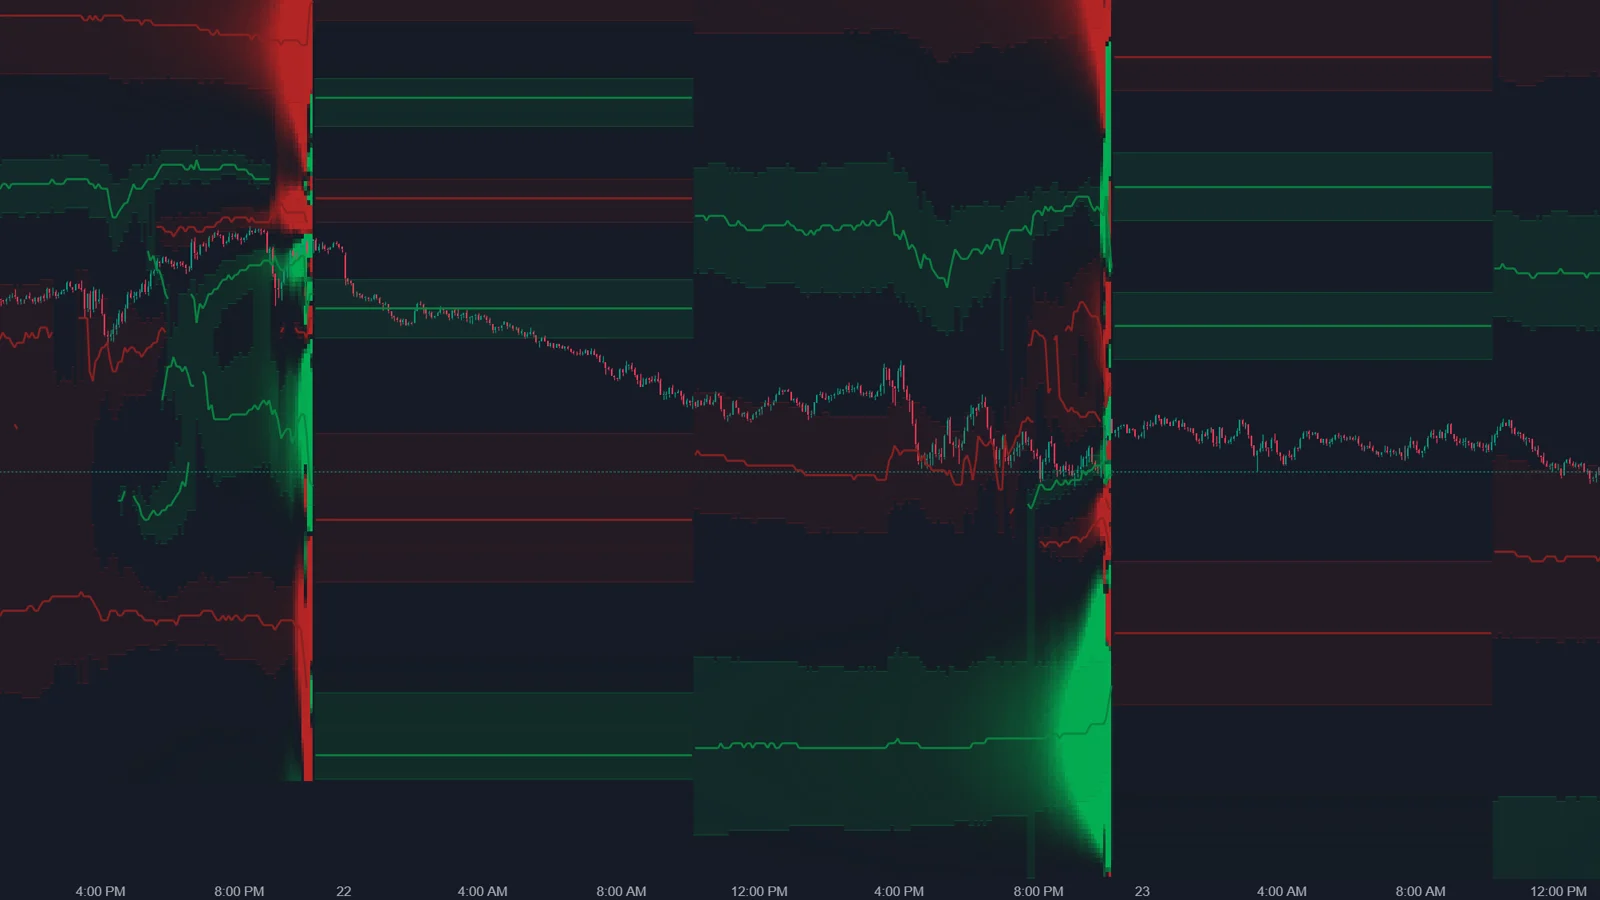
Options X-Ray: Charm Heatmap shows on the ES chart where and when market makers may need to buy or sell ES futures only because time is passing. By default, green areas mark expected buying and red areas expected selling, brightness shows size in ES contracts, and the map extends to the end of the session as a forecast that assumes positions do not change.
What is charm, and why does it create flow?
Charm is the change in an option's delta as time passes. A delta-hedged position therefore needs adjusting even when price does not move.
ATAS explains it this way: as options approach expiration, options that are not profitable at the current price have less time left to become profitable, so their delta shrinks. The futures hedge that fit before becomes too large or too small, and the market maker adjusts it by buying or selling ES, even without news. The direction depends on positions, not on the time of day. When traders hold protective puts, time decay can push market makers toward buying; with more call exposure, the same mechanism can work the other way.
How do I read the map?
| Element | Meaning |
|---|---|
| Green area (default colors) | Time decay is expected to force market makers to buy ES |
| Red area (default colors) | Time decay is expected to force market makers to sell ES |
| Brightness | How many ES contracts may need to be traded |
| Pressure zones | Bands with a line at the strongest level, which can move during the day |
| Right-edge column | The profile for the next trading day |
Do not confuse the colors with the GEX Heatmap. In the Charm Heatmap, color is direction: buying or selling. In the GEX Heatmap, the same colors describe damping or amplifying. The hover card shows BUY PRESSURE AHEAD or SELL PRESSURE AHEAD with an approximate number of ES contracts, and marks the forecast part as forecast, not observed.
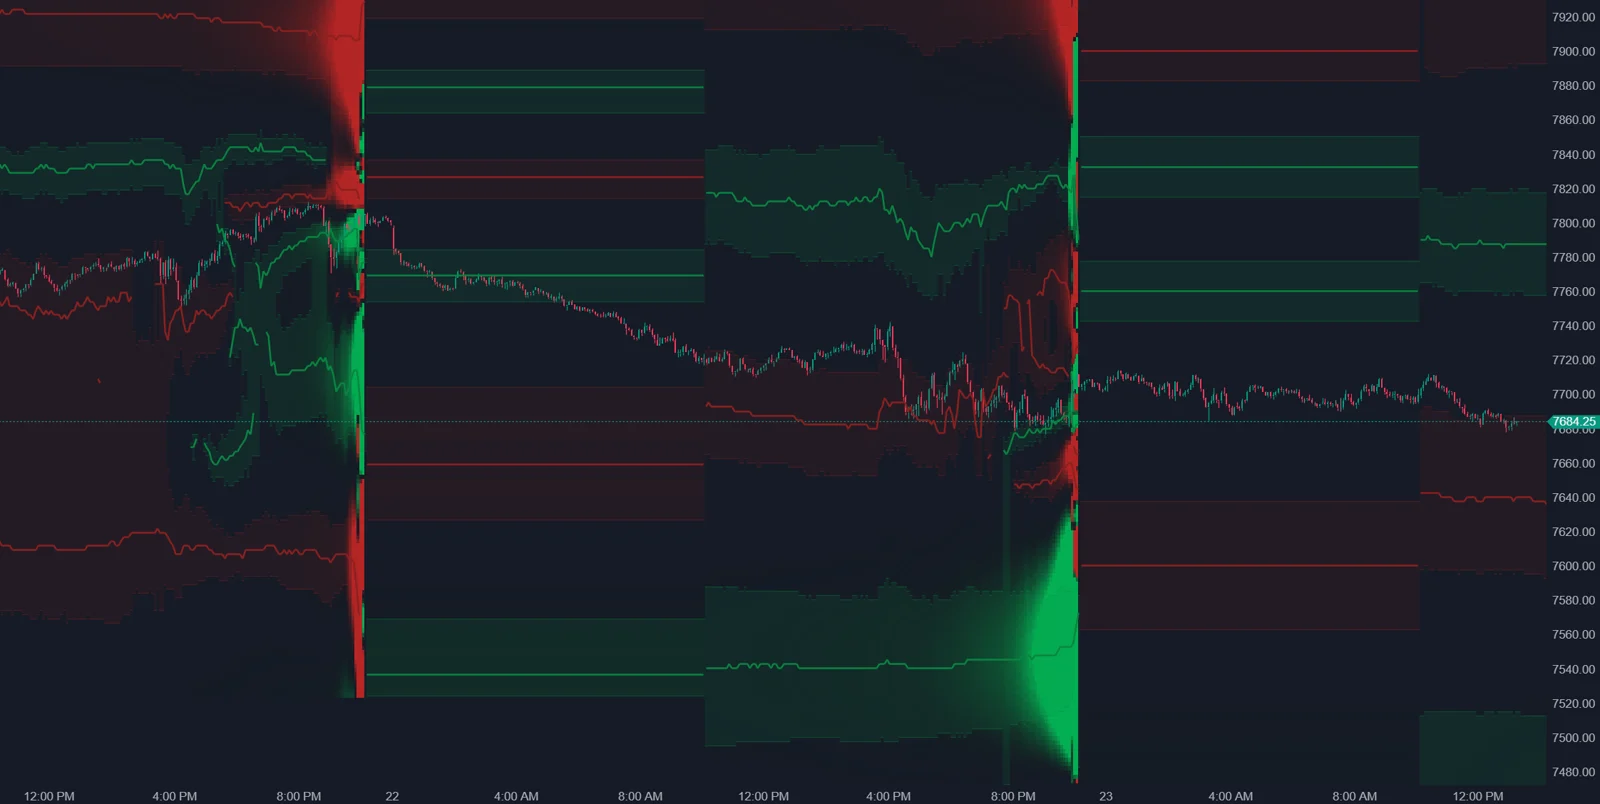
From practice: in the author's own setup in October 2026, the Options X-Ray indicators run in ATAS X. The ATAS help articles do not say which platform version they cover, so treat this as the author's experience.
When is charm flow strongest?
Usually closer to the close. A large share of S&P 500 options volume is in options that expire the same day, and the less time remains, the faster the required hedge changes. ATAS notes that the map is often barely visible in the morning and that the flow is usually stronger after midday. It also calls the Charm Heatmap one of the most direct X-Ray maps, because its condition is the passage of time, and time always passes.
Why is it still a forecast?
- ATAS calls it a calculated estimate of how much market makers may need to trade based on current positions, and says it does not confirm that real trades have happened.
- The forecast part assumes positions stay the same; it is recalculated every minute and changes when they do not.
- Market maker flow is one force among many. ATAS notes that news or a large participant can override it.
- The data covers SPX options. The map uses all expirations together and has no expiration selector.
Which settings does it have?
| Setting | What it does |
|---|---|
| Color scheme | Default red to dark to green: red selling, green buying |
| Brightness, Contrast | How visible the map is and how strongly peaks stand out |
| Show zones | Pressure zones around the strongest levels; on by default |
| Peak sensitivity % | How strong a level must be to get its own zone |
| Zone width % of peak, Zone opacity | Width and fill of the zones |
| Hover tooltip, Show status | Card on hover; status line with calibration notes |
How do I use it in a session?
- Check which color zone price is in now.
- Look at the forecast area: how may the flow at the current level change toward the close?
- Hover nearby bright zones and note the size in ES contracts.
- In the afternoon, compare the expected direction with the footprint. A steady drift with small, one-sided delta fits a charm reading; a sharp move on news does not.
Market State condenses the same question into its DECAY tile, which estimates charm flow over the next 30 minutes under three price scenarios.
FAQ
Why is the map almost empty in the morning?
Time decay flow is usually weak early and grows toward the close. ATAS calls this expected.
Does green mean price will go up?
No. It means the model expects market maker buying from time decay at that level. Other flows can be larger.
Why does the forecast area keep changing?
It uses the latest positions every minute. When positions change, the forecast changes.
Can I select an expiration?
No. The Charm Heatmap is calculated from all options together. Strike Profile and Strike Heatmap offer charm per expiration.
This article is educational content, not financial advice.