

ATAS Options X-Ray Market State: The Options Summary Panel
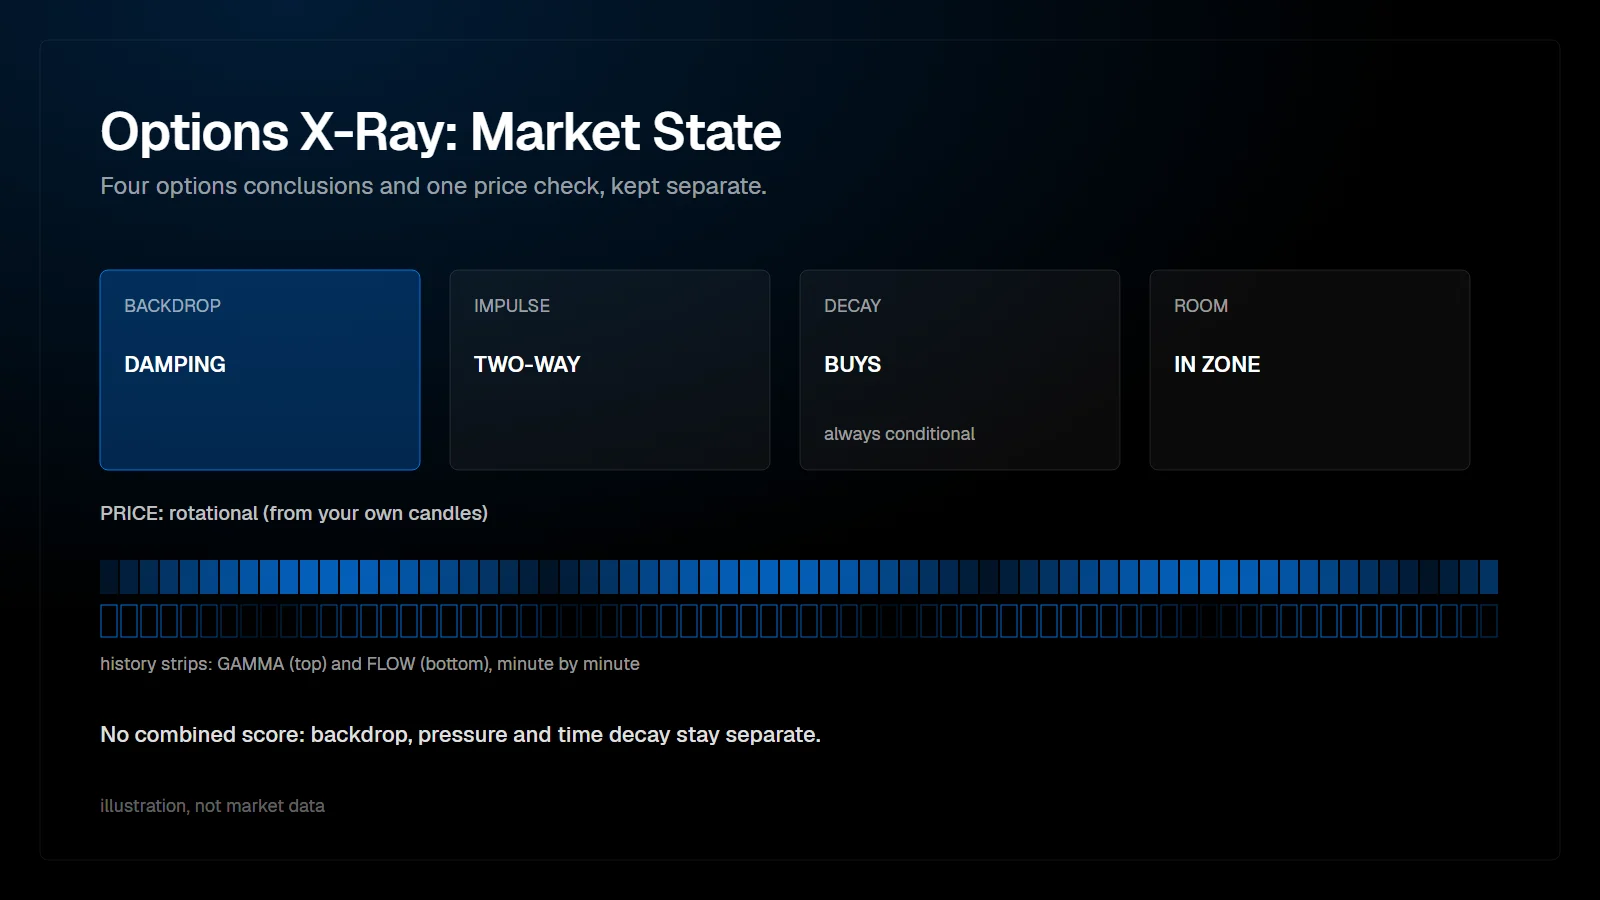
Options X-Ray: Market State is a panel below the ES chart that condenses the other X-Ray indicators into four tiles, Backdrop, Impulse, Decay and Room, plus a Price check from your own candles and two history strips for the session. Each conclusion carries a label that says whether it is observed, derived from positions or a conditional forecast. It updates every minute.
What do the five conclusions answer?
| Conclusion | Question | Possible values |
|---|---|---|
| BACKDROP | Will movement be damped or amplified right now? | DAMPING, AMPLIFYING, MIXED |
| IMPULSE | Which way are participants pushing? | CLIENTS LEAN LONG, CLIENTS LEAN SHORT, TWO-WAY |
| DECAY | Which way may time decay push over the next 30 minutes? | DECAY BUYS, DECAY SELLS, PATH-SENSITIVE, EXPIRY-SENSITIVE |
| ROOM | How much room is there before the nearest damping levels? | Zone, expected move, distance to the flip |
| PRICE | Is price moving directionally or rotating? | DIRECTIONAL, ROTATIONAL |
There is deliberately no combined score. ATAS argues that backdrop, participant pressure and time decay are different forces, and combining them into one number would create false precision.
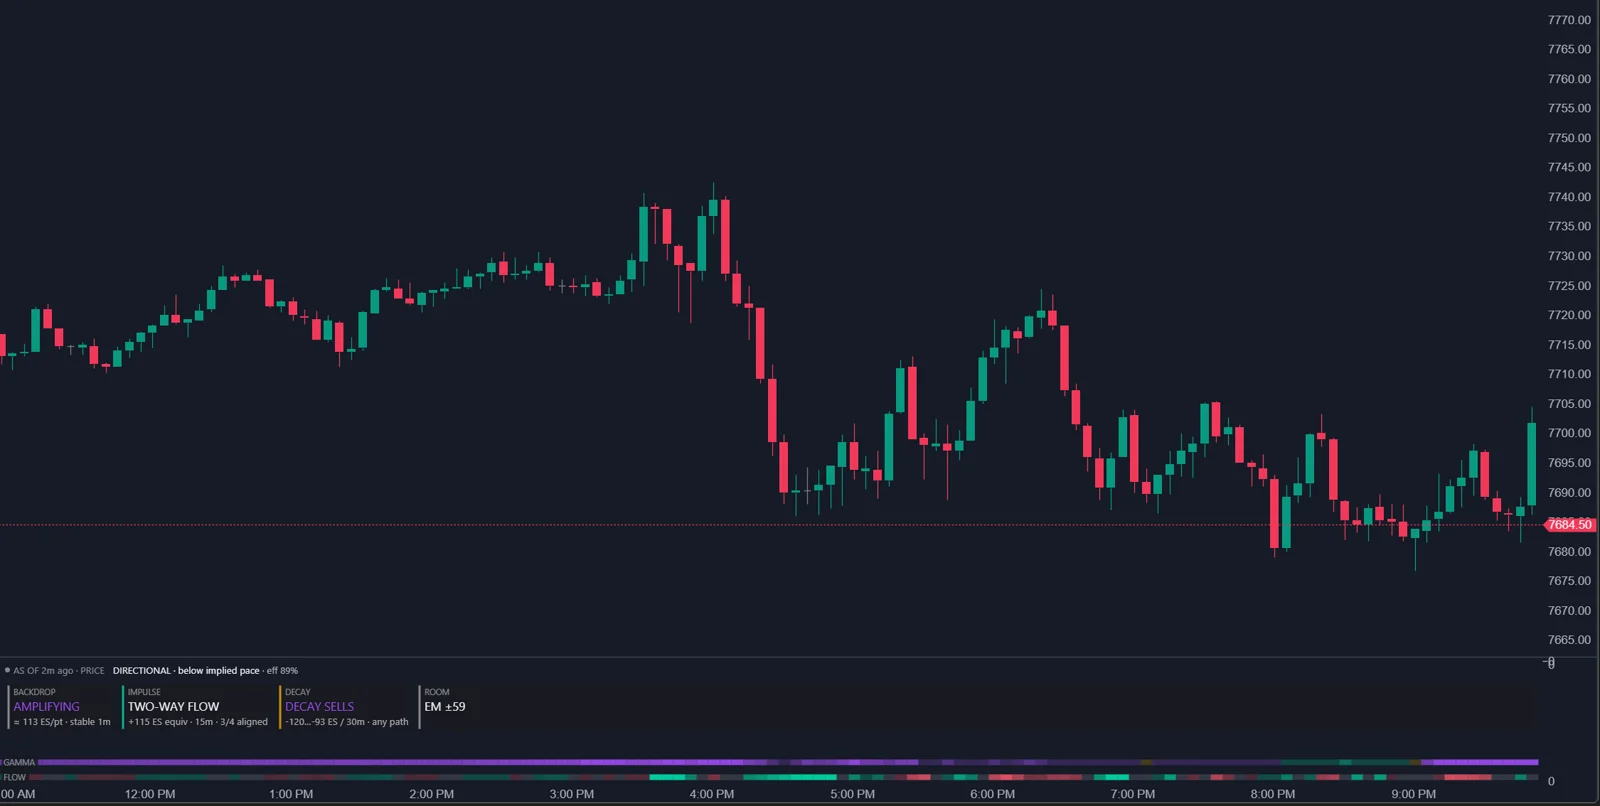
From practice: in the author's own setup in October 2026, the Options X-Ray indicators run in ATAS X. The ATAS help articles do not say which platform version they cover, so treat this as the author's experience.
What do the confidence labels mean?
| Label | Meaning |
|---|---|
| OBSERVED | Based on something that already happened: real trades or real price movement |
| DERIVED | Calculated from current market positions |
| CONDITIONAL | A forecast that holds if positions and volatility do not change |
This is the most useful part of the panel for judging how much weight a reading deserves. DECAY is always conditional, because it is a forecast.
How are the tiles calculated?
- BACKDROP: the GEX Heatmap question in one word, with strength in ES contracts per point. A new state must hold for three consecutive minutes, and at least five minutes must pass since the last change, to avoid flicker.
- IMPULSE: the direction in which all client groups together shifted positions over the last 15 minutes, across all strikes and expirations. Below 50 ES contracts the imbalance is not treated as directional, and the last 5 minutes must agree with the 15-minute direction.
- DECAY: the Charm Heatmap question for the next 30 minutes, checked for flat, slowly rising and slowly falling price. With less than 45 minutes to expiration it shows EXPIRY-SENSITIVE without numbers.
- ROOM: for example IN ZONE 7798-7808 · EM +/-29 · flip up 0.9 EM30, meaning price is inside a damping zone, the expected move is 29 points, and the flip is 0.9 typical 30-minute moves above.
- PRICE: the only conclusion without options data. Over the last 30 minutes, if the net displacement is more than 55% of the path traveled, it is directional; below 45%, rotational.
How do Backdrop and Price combine?
| Backdrop + Price | Meaning according to ATAS |
|---|---|
| AMPLIFYING + DIRECTIONAL | The picture agrees: the move is real |
| DAMPING + ROTATIONAL | The picture agrees: a normal choppy day |
| DAMPING + DIRECTIONAL | Pressure is pushing through a damping background |
| AMPLIFYING + ROTATIONAL | Conditions for a sharp move exist, but nobody has started it yet |
The Impulse card adds push against cushion: whether participant pressure looks large enough to get through the damping zone ahead. No cushion in its path means the backdrop in the direction of the pressure is amplifying, which ATAS calls the most trend-friendly environment.
What do the history strips show?
Two strips at the bottom show the session minute by minute. GAMMA colors damping, amplifying and mixed backdrop; FLOW colors upside, downside or no clear participant pressure. Brightness is scaled per session, so a bright spot means strong for that day. A segment stays empty when there were no fresh data for more than 10 minutes, because the indicator does not draw stale data.
How do I work with Market State?
- Check the freshness dot in the status line.
- Read BACKDROP and compare it with PRICE.
- Read IMPULSE: where are participants pushing, and is the push larger than the cushion?
- Read ROOM: how far to the nearest zone and to a flip?
- Read DECAY: may time decay help or resist over the next 30 minutes?
- Open the detailed indicators when needed, and decide entries with tape, clusters and delta.
For an order flow trader, the panel is a pre-trade context check that fits next to the footprint. A DAMPING + ROTATIONAL afternoon argues for fading extremes with absorption; AMPLIFYING + DIRECTIONAL argues against fading.
FAQ
Why are there no numbers on the tiles?
The panel is too low. Increase its height; numeric rows disappear first when space is short.
Why does IMPULSE say TWO-WAY while Flow Delta looks directional?
IMPULSE uses all client groups and all expirations over 15 minutes and requires the last 5 minutes to agree; Flow Delta defaults to Retail and Pros and 0DTE.
What does a yellow status dot mean?
The latest data arrived with a delay. Wait for the next update.
Is Market State a trading signal?
No. ATAS describes it as the environment in which you trade, not an entry signal.
This article is educational content, not financial advice.