

ATAS Options X-Ray Hedge Pressure: Market Maker Delta Since the Open
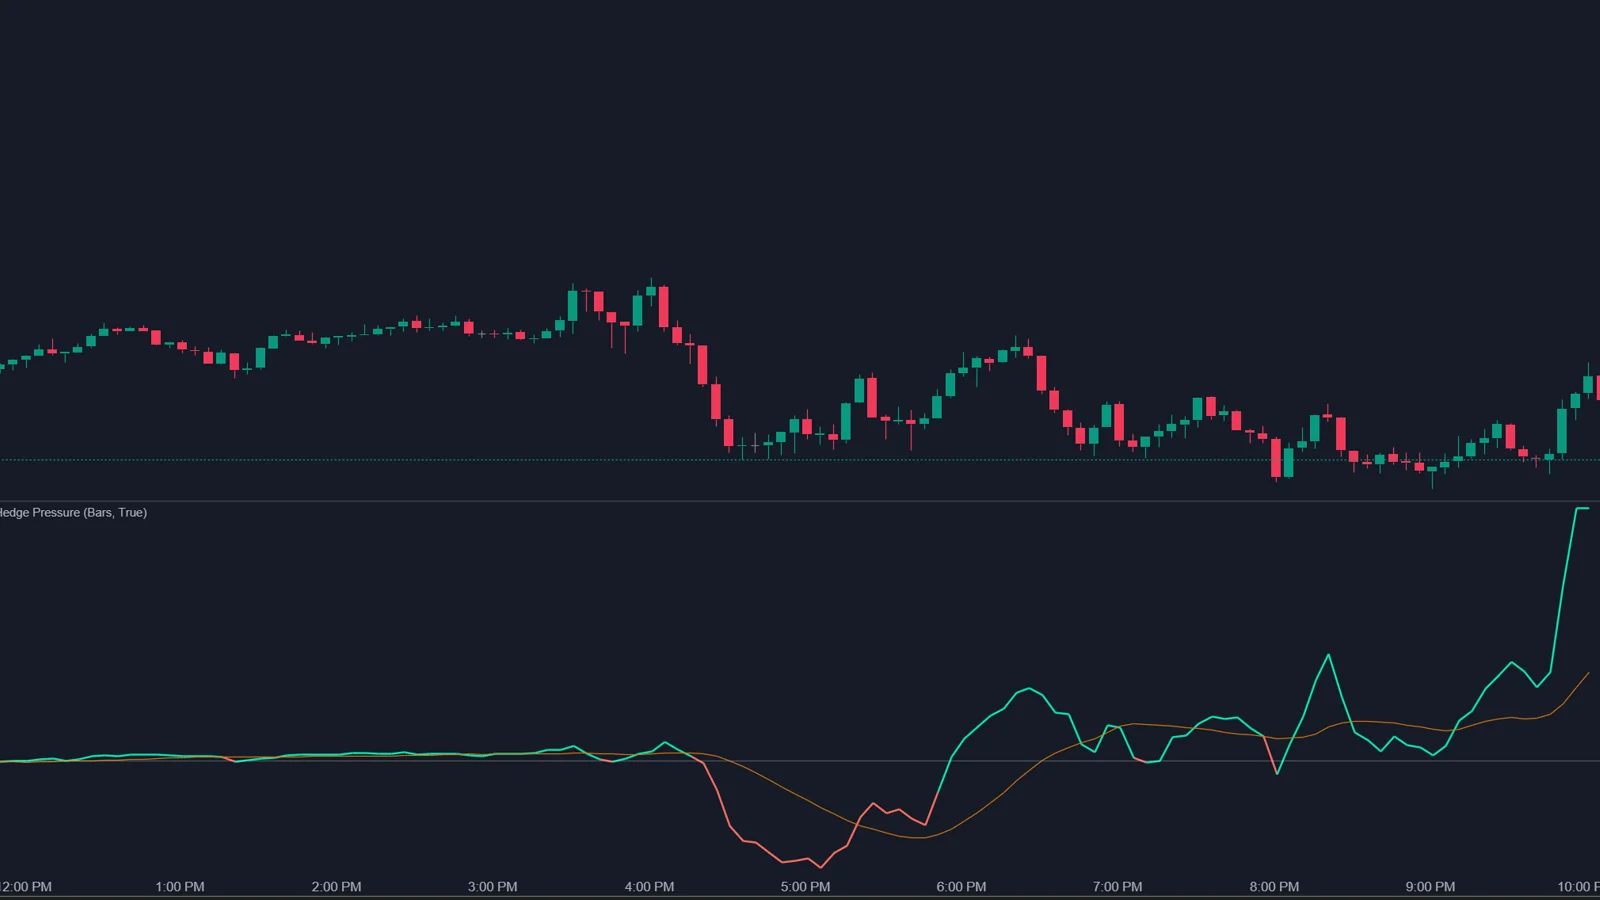
Options X-Ray: Hedge Pressure draws one line in a panel below the ES chart: how much the delta of the market maker position in SPX options has changed since the start of the session, in ES contracts. A rising line means market makers became longer delta and would sell futures to stay neutral; a falling line means they would buy. Every session starts at zero.
What does the line measure?
The change in market maker delta, read as the hedge that has been or still has to be made.
| Line | What happened | Hedge needed to stay neutral |
|---|---|---|
| Above zero and rising | Market makers became longer in delta | Sell futures: selling pressure |
| Below zero and falling | Market makers became shorter in delta | Buy futures: buying pressure |
As described by ATAS. One SPX option delta equals two ES contracts.
ATAS calls the line a consequence, not a forecast: it shows what already happened to the market maker position and does not promise that the hedge is executed in that exact minute. The values come from options positioning, not from candles, so the line is the same on any timeframe.
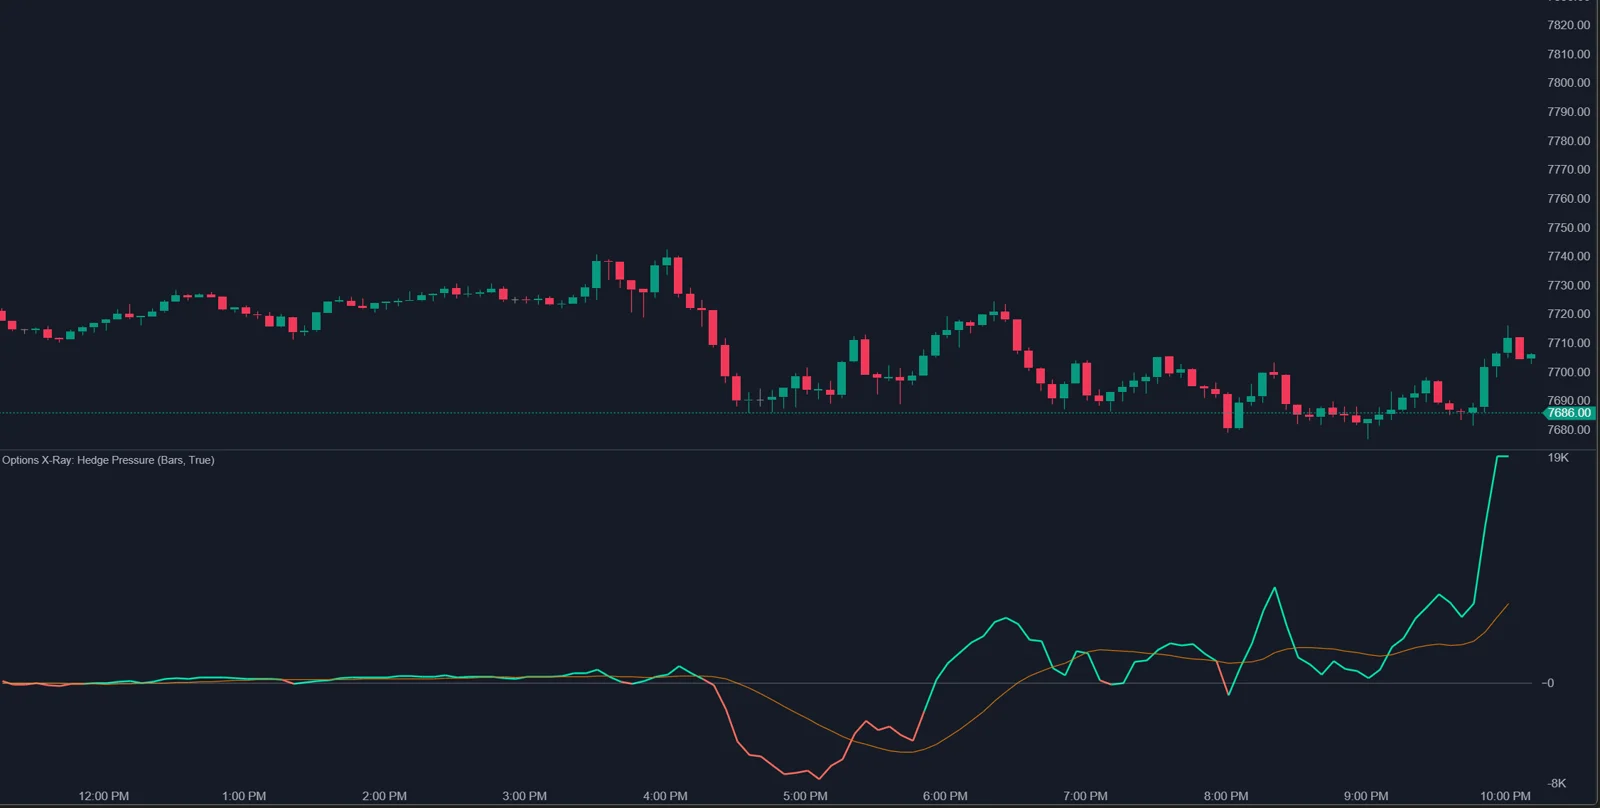
From practice: in the author's own setup in October 2026, the Options X-Ray indicators run in ATAS X. The ATAS help articles do not say which platform version they cover, so treat this as the author's experience.
How do I read it next to price?
Like cumulative delta: the behavior next to price matters more than the exact number.
- Line moves with price: on a rally market makers get longer and sell, on a drop shorter and buy. Hedging works against the move; the day tends to be slow and moves fade.
- Line moves against price: on a rally market makers get shorter and have to buy more. Hedging works with the move and can speed it up.
- Line crosses its moving average: the pressure inside the day has changed direction.
What are the two parts of the line?
Market maker delta changes for two reasons, and the indicator can draw them separately. Together they add up to the main line.
| Part | What it shows |
|---|---|
| Price movement | The existing position was revalued because price moved, without anyone trading |
| Client trades and time | New client positions and the effect of approaching expiration on delta |
ATAS gives an example from 9 October 2026: price rose all day and the line rose with it to about +20,000 ES contracts, roughly two thirds from the price part and one third from trades, so hedging worked against the rally. Toward the close the parts separated, trades pushed delta below zero, and the main line lost three quarters of its gain in forty minutes. The price part is zero before 09:30 New York time, because the SPX index is not quoted yet and every change comes from trades.
When is the line available?
While SPX options data is available, from about 04:00 to 16:00 New York time. In the evening and at night there are no values, and the line resumes from zero with the next session. Options close at 16:00, so the line ends earlier than futures trading.
Which settings matter?
| Setting | Default | What it does |
|---|---|---|
| Expirations | 0DTE | Options expiring today carry most of the intraday hedging, according to ATAS |
| Show values in | ES contracts | Or US dollars of notional value |
| Show the two parts of the line | Off | Draws the price part and the trades-and-time part |
| Show moving average, period | On, 15 bars | Average restarts every session; period 2 to 100 |
| Show status | Off | Problems are reported regardless |
What are the limits?
- It covers market maker positions in SPX options from OptionsDepth data, not market maker positions in other products.
- It shows the hedge that would keep the position neutral. Whether and when market makers actually trade that hedge in ES is not observed.
- The split into two parts is not available for every past session; the main line is still drawn.
How do I combine it with order flow?
Compare it with cumulative delta in ES. If Hedge Pressure says market makers should be selling into a rally and the ES footprint shows the rally stalling with absorption at the offer, the two readings agree. If Hedge Pressure moves against price and ES shows strong initiative with little resistance, that is the environment ATAS describes as hedging working with the move. Key Levels or the GEX Heatmap add where by price that hedging is strongest.
FAQ
Why does the line start at zero every day?
It measures the change since the session start, not the total market maker position.
Why is there no line at night?
SPX options data is available from about 04:00 to 16:00 New York time. Outside that window the position does not change.
Do values change with the chart timeframe?
No. Each bar shows the position at its close, and the current bar shows the current minute.
Is a rising line bearish?
Not as a signal. It means market makers would need to sell to stay neutral. Whether price falls depends on everything else trading at that moment.
This article is educational content, not financial advice.