
ATAS X Masterclass: The Complete Setup and Workspace Tutorial
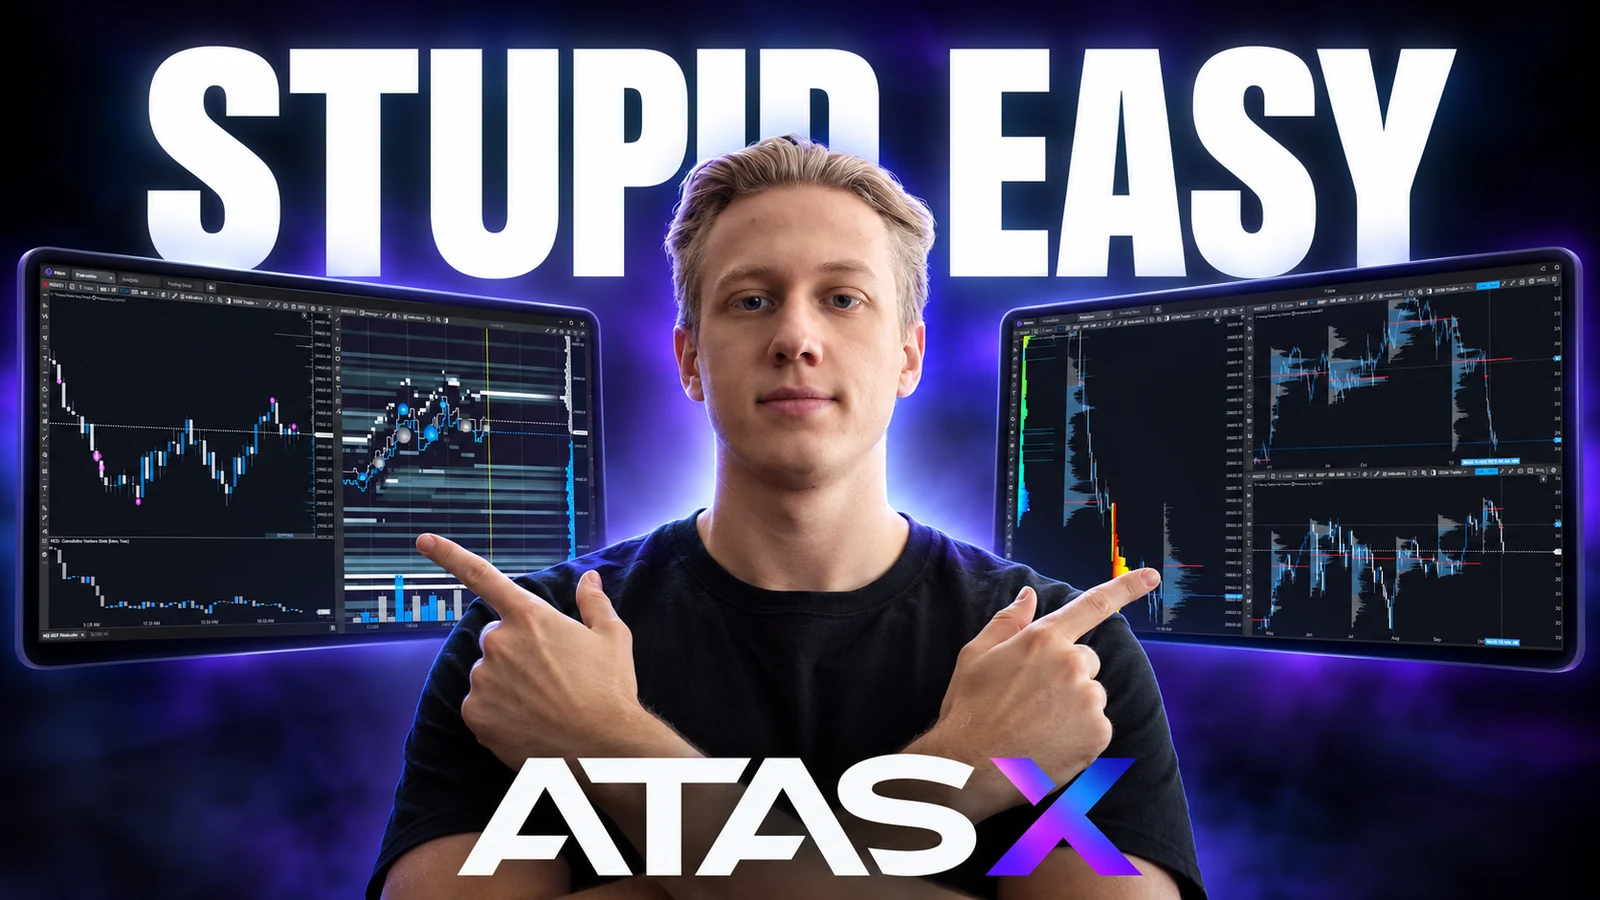
This is the written version of my ATAS X masterclass: everything from choosing a plan and connecting a data feed to building a full workspace with an execution chart, footprint, heatmap, volume profile, copy trading, risk manager, replay and order entry. Every step follows the video, so you can read it, jump to the exact minute you need, or build along while it plays.
The workspace is built from scratch in the video. The point is not to copy my colors, but to understand each setting well enough to build your own and save it as a template.
Which ATAS version should you buy?
For real-time futures data, Pro or Ultra.
On the pricing page at the time of recording, only Pro and Ultra could connect real-time futures data. The Plus plan came with a 15-minute delay, which is no use if you trade order flow. Pro has no MBO bundle, and it includes the regular options chain but not the Options X-Ray indicators, a set of about ten tools for options flow that use data from the CBOE and cover ES only. Ultra includes everything: as many connections and data providers as you want, cross trading and all indicators. My advice in the video: if you have the money and want to invest in serious charting software, go with Ultra, even as an NQ trader, because you can chart ES next to NQ and use its gamma levels and correlation.
The paid plans start with a 14-day free trial. After that you pay monthly or for longer periods, which works out cheaper per month. In the video I also mention that ATAS ran a Black Friday offer last year and that the lifetime version is worth a look when it is discounted. Plans and prices change, so check the current comparison on atas.net before you buy.
Where do you download ATAS X?
In the personal area at my.atas.net, under Download ATAS.
After you register and activate the trial, the myATAS dashboard shows your license type and the remaining days, plus your profile, payment methods, orders and the partner program. The page you need is Download ATAS: it offers ATAS X for macOS and Windows next to the older ATAS Classic. At the time of recording, ATAS X carried the beta label there.
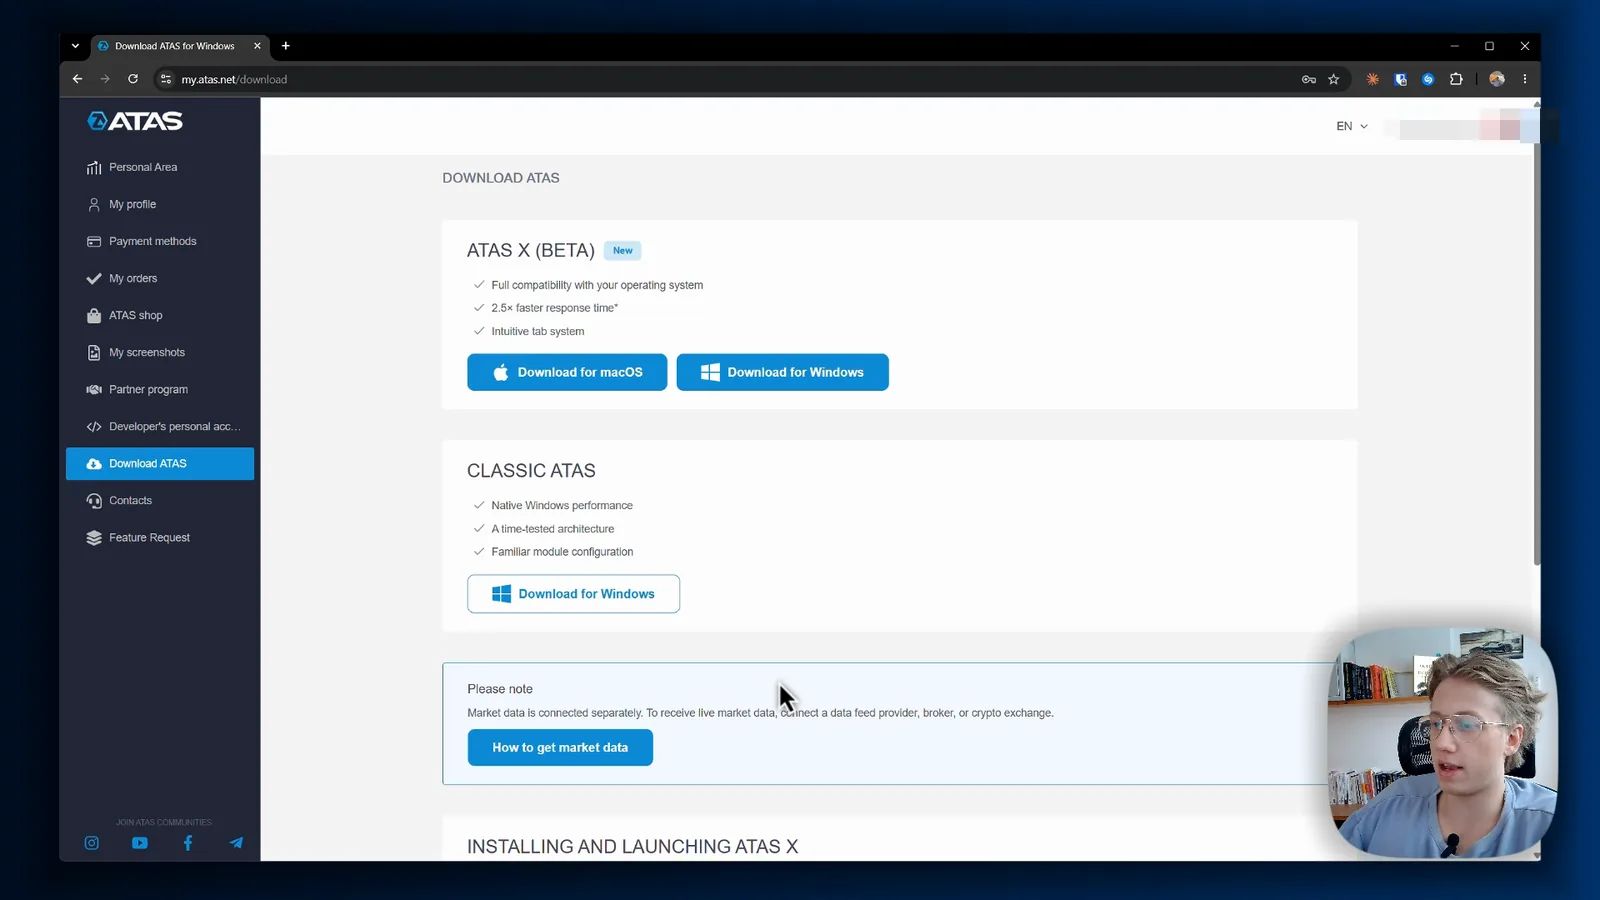
ATAS also states on that page that market data is connected separately. The download does not include a data feed, so you need real-time futures data through a prop firm or broker account, or a crypto exchange if you trade crypto.
On hardware, ATAS lists 8 GB of memory as the minimum. I would not go below 16 GB, and 32 GB is better, together with a decent graphics card if you plan to use the heatmap and let the GPU render it.
How do you log in and open ATAS X for the first time?
Leave the server on auto and start without a workspace.
The login window asks for your credentials, the server and a workspace. Keep the server on auto. The workspace field is for layouts you saved earlier: once your charts sit exactly where you want them on your screens, you save them as a workspace, and next time you pick it here and ATAS opens everything as you left it. For this build, choose do not load any workspace and click connect. A small notice about indicators with high default loaded days is only a recommendation from ATAS; my PC runs charts with higher values without trouble.
How do you connect your data feed?
Open connections, click the plus, pick your data provider and enter the credentials your provider sent you.
ATAS X is built from a menu bar, tabs for your windows, and widgets you drag into place. Before any chart works, the connection has to be set up, because real-time futures data comes from a provider and not from ATAS itself.
- Open the menu, then connections. The list shows the ATAS Sim connection plus any provider accounts you already added.
- Click the plus to add a connection and select your data provider in the list, for example Rithmic or dxFeed.
- Give the connection a name you will still understand later, for example the account it is routed to.
- Enter the login and password you received from the data feed provider, then click finish.
- If everything went through, the connection shows as connected.
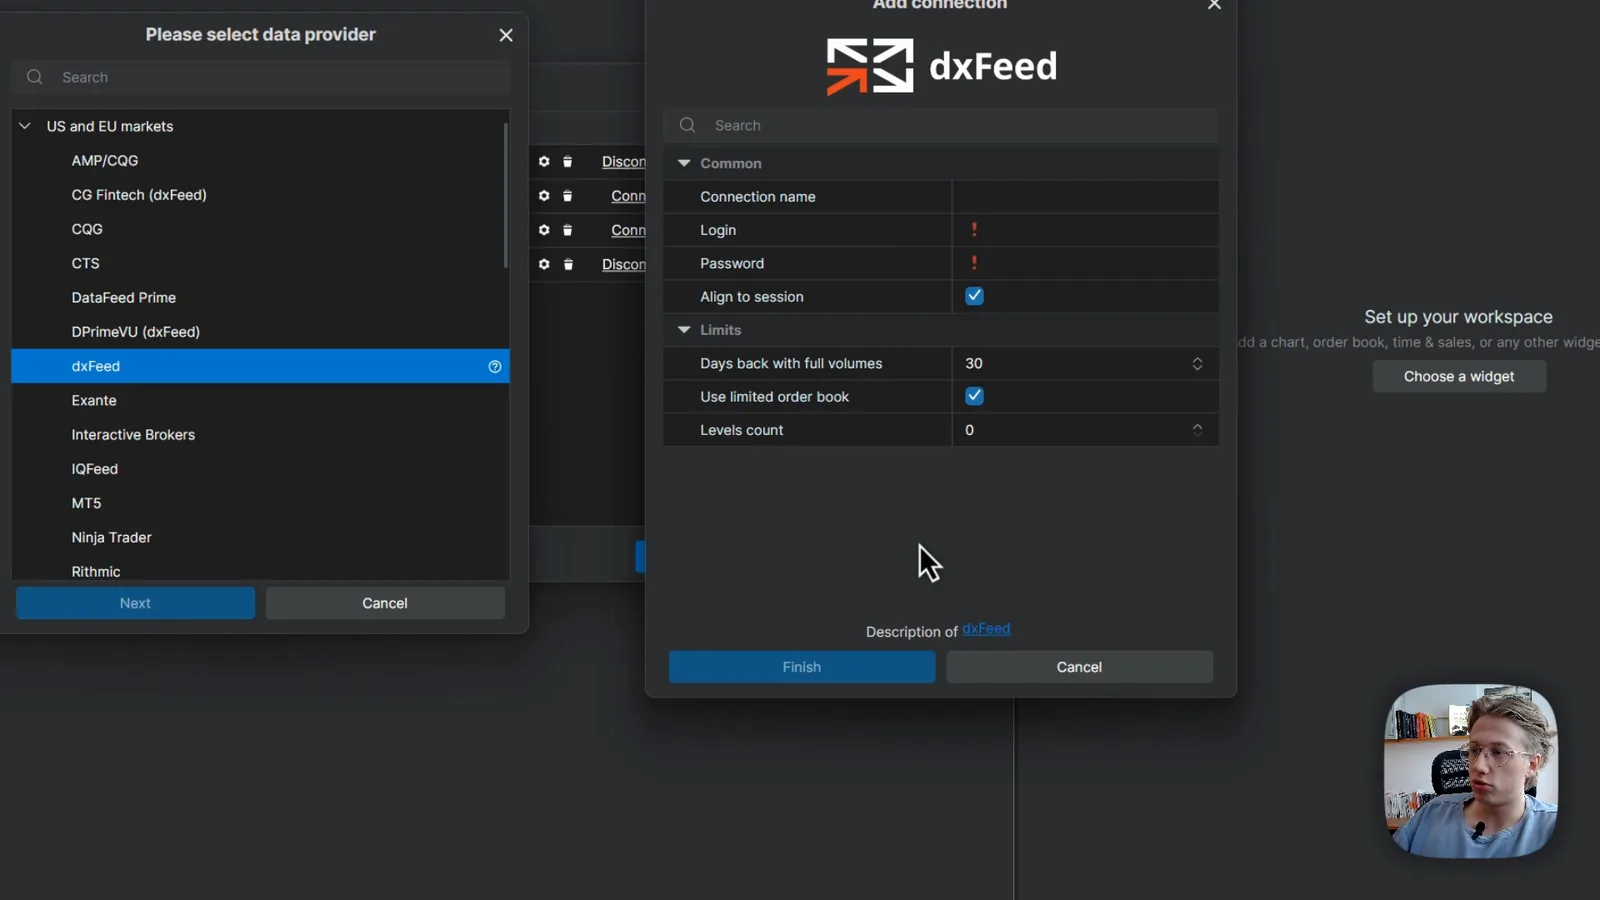
Two details cost me time at some point. First, if you want the full order book, keep the limited order book option switched off on a dxFeed connection, because it caps the depth. If you want to analyze 500 levels, that setting would block it. Levels count set to 0 should give full depth; if nothing shows, raise it, for example to 2000. Second, mark only one connection as your quotes provider. Two providers feeding different data into the platform can produce odd results, and it took me a long time to find that out. You can still connect several accounts, for example a demo account and a prop account, and pick the one you trade from in the chart trader, while a single account stays your data source.
Switch on auto connect for the connection you use every day, so ATAS connects when you open your workspace. The same menu also holds alerts (including Telegram and webhook notifications for events such as a trend line being touched), a learn section with templates from ATAS, and your license type, expiration date and platform version. The version is worth knowing, because support and Discord helpers will ask for it.
Which common settings should you change first?
Do them before anything else on a chart. They apply to the whole platform.
| Setting | What I use | Why |
|---|---|---|
| Levels count (depth of market) | 500 | Enough depth for me; the heatmap has its own levels count |
| Enable cross trading | On | Lets you chart one instrument, say NQ, and trade another, say MNQ |
| Auto add best prices indicator | Off | Extra best bid and ask lines were just noise on the chart for me |
| Do not show warnings | On | I do not want the same warning every time |
| Value area percent | 70 | The share of volume inside the value area of a volume profile |
| Levels at a time | 1 | Aggregating ticks is easier to change per chart later |
| Continuous profile source | All period | Shows profile history across rolled-over contracts |
| Max candles per chart | Set to the maximum | So indicators can load as much history as possible |
| MBO analytics | Defaults, not used | I do not use iceberg detection or MBO history |
| Renderer type | OpenGL | Graphics-card rendering; I mention Vulkan for Mac users |
| Heatmap rendering | Dedicated GPU, FPS cap manual at 60 | A higher cap makes the graphics card work harder and can slow the PC |
Common settings from the masterclass.
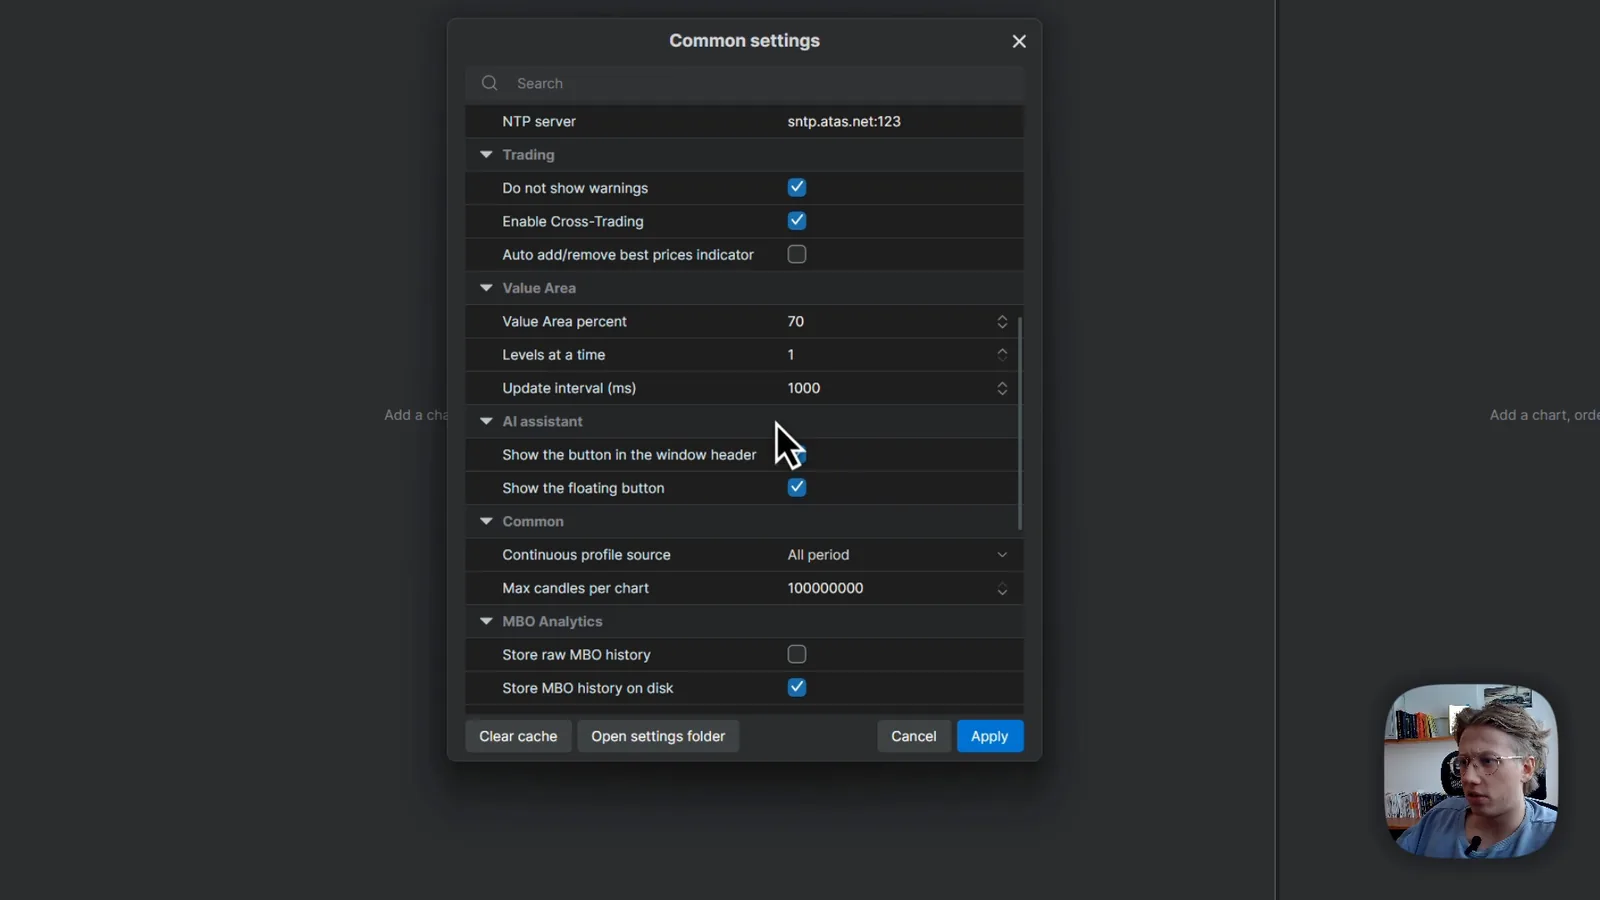
ATAS does not back-adjust contracts and volume at the moment, so a volume profile on a continuous contract can differ from other platforms. Many users have asked for this feature for years.
At the bottom of the window are two buttons I use regularly. Clear cache is the fix when ATAS keeps loading an old version of an indicator after you imported a new one. Open settings folder shows where ATAS X stores its workspace backups, cluster and indicator templates and everything else, which is good to know when you move to another PC. After changing common settings, apply and restart ATAS.
What are sounds, custom modules, time zone and hotkeys for?
Small settings that save you trouble later.
- Sounds: switch events on or off and import your own sounds per event. A nice extra, not worth much time.
- Custom modules: installed and available third-party indicators. If an indicator you bought does not show up in the indicator menu, the auto-load option for third-party modules may be disabled. Install it manually here, click apply, and it appears in the menu.
- Time zone: the time on the chart's x axis comes from this setting. Detect automatically uses your computer's time. To match New York, pick the Eastern time zone, which was UTC-4 when I recorded.
- Hotkeys: I deleted the hotkeys for buy and sell at market, buy ask and buy bid, so I cannot trigger an order by accident while charting. The chart trader keeps its default T key. I assigned the volume profile and the horizontal highlight line to my mouse.
- Help: you can record a performance trace there, which the ATAS developers sometimes ask for when the heatmap crashes.
How do widgets and the chart work in ATAS X?
Every window is a widget, and you pick the instrument inside it.
The available widgets are chart, smart DOM, smart tape, bid/ask tape, all prices, heatmap, options board, following manager, replay table, risk management and web pages. Right-click a widget header to rename it, replace it with another widget, clone it, open it in a new window or tab, or close it. For the chart you first choose the instrument in the instrument manager, which lists stocks, indices, US futures, crypto and more. I trade the continuous contract, so I never have to track which contract is about to expire. Click the star next to an instrument to make it a favorite and it appears in the favorites list for quick access.
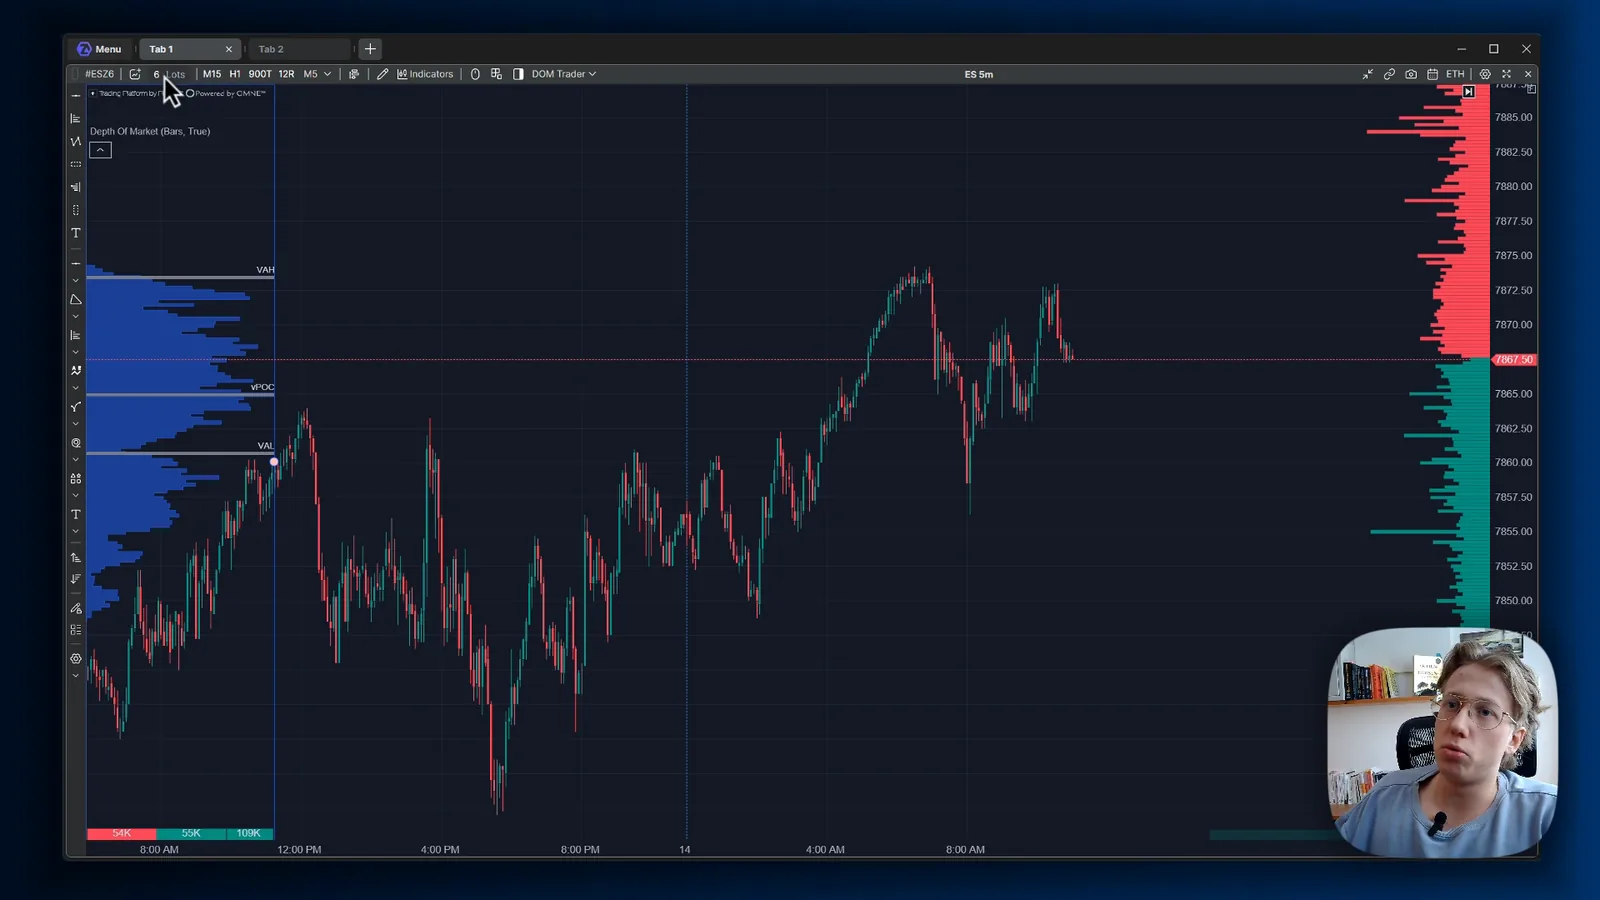
The chart header holds the controls you will use all day:
- Groups and overlay: color-code charts into groups, and overlay a second instrument, for example NQ on ES, as line or candles with its own opacity, percent of the visible range or a separate axis.
- Lots: the default order quantity for the chart trader, kept in sync with the header.
- Time frame: the list of favorites, a date range if you want to load specific days, and configure, where you add your own tick, minute, volume, delta or range charts with their default loaded days. In the video I add a 16 range chart, which equals 4 points on ES, and mark it as a favorite so it shows up in the header.
- Candles: switch between footprint, transparent candles, line, bars, hidden and area, and pick volume or delta based variants.
- Indicators: all of them, plus the ones you made favorites. The about tab opens the explanation on help.atas.net.
- Mouse and crosshair: pointer or crosshair, and the global crosshair, which I always keep on. With a cloned chart, a line you draw or a level you hover on one chart appears at the same place on the other. Mouse wheel set to zoom XY; hold control to stretch the x axis and shift for the y axis.
- Scale: aggregates price levels. With a scale of 4 on NQ, four ticks become one bar, which makes a footprint easier to read. Set it back to auto for the granular view.
- Link price axis: links the zoom of two widgets, for example a chart and a heatmap, so zooming one zooms the other.
- Trading sessions: electronic trading hours or regular hours only, and custom sessions.
How do drawing objects work?
Pick favorites in the drawing menu and they show up in the toolbar on the left.
If you do not see the toolbar, right-click the chart, open drawing objects and tick the toolbar option. The toolbar offers the usual tools, from horizontal lines and Fibonacci to ruler, shapes and long or short position tools, and the interface feels close to TradingView. Mark the volume profile and the highlight Y line as favorites; the highlight Y is a horizontal band running across the whole chart, which is handy for support and resistance areas. A magnet snaps a drawing to the high or low of a candle.
The object list is the control panel for everything you drew. You can delete single drawings or all of them, make a drawing visible only on certain time frames (a daily chart level can show on your execution chart but not on the one-hour chart), and lock a drawing so you cannot drag it by accident while hovering over the chart.
How do you build the workspace structure?
With tabs, clones and replaced widgets.
I use three tabs: Execution, Analysis and Trading Stats. Create a tab with the plus, choose a widget for it, and rename it with a right-click. To fill the trading stats tab, choose the tables widget and pick positions, then clone it and replace the clone with orders or trades. Drag a widget by its header to wherever you like, and ATAS places it. To add a second chart, add a new chart widget or clone an existing one; the clone keeps its instrument and settings until you change them.
My goal for the masterclass workspace was an execution chart, a heatmap, analysis charts with a volume profile and a TPO profile, several indicators, trading stats and the following manager. Keep it structured, name things properly and save them as templates from the start.
How do you set up the execution chart?
Start with a foundation template that holds your colors, then build on it.
Open the chart settings. In the visual settings, I darkened the background to a dark blue, set the up candle to a bright blue and the down candle to gray, removed candle borders, deleted the grid lines and made the new-session line transparent. Transparent is the trick whenever ATAS has no off switch for something you do not want to see. I turned off auto transform candles to footprint, because I do not want the chart to switch candle types as I zoom, and set volume digits to two. In the trading settings I enabled one-click mode, so the chart trader does not ask for confirmation on every order, and colored buys green and sells red so entry and exit triangles match.
Then save it. Open templates, choose save, pick or create a directory, and name the template. I saved this one as a foundation template with chart settings and drawing objects, but without indicators and time frames, so every later chart (execution, analysis, volume profile) starts from the same colors and defaults. Mark it as a favorite to load it quickly.
For the execution chart itself I added a 900-tick time frame with three default loaded days, so there is some history. Then the indicators:
- CVD (cumulative volume delta) in its own panel: candles as visual mode, positive in the chart's blue, negative in gray, optional zero line. Save it as a template immediately. If ATAS crashes or you restart, indicators without a saved template come back with default colors.
- Trades on Chart: shows the entries and exits of the trades you take, with a line between them. Set buy, sell and profit colors, and save the template.
- PFT EdgeBook Bridge: links your ATAS X chart to PFT Terminal. The default settings are fine. It is free and the link is in the video description.
- Volume Profile and TPO on the execution chart if you want it there. The volume profile indicator has no template function of its own, so the way to keep it is to save the whole chart as a template.
- Depth of market: I changed the bid and ask rows to the chart's blue and gray, and adjusted filter, scale and width to taste.
How do you set up the heatmap?
Add a heatmap widget to the tab, choose the instrument, and tune color, bubbles and depth.
Click the plus, choose new widget and heatmap, then pick the instrument. It is not as feature-rich as dedicated heatmap tools, but it is part of the ATAS package. The quick settings panel covers the color scheme, brightness, cut-off (to minimize noise), bubble size and clustering, and what the bubbles are calculated from. Best bid/ask draws the best prices as a line, depth of market shows the order book on the side, and volume at the bottom can be switched to delta, which is what I prefer. Stop bubbles need MBO (level 3) data from your provider, so I leave them off.
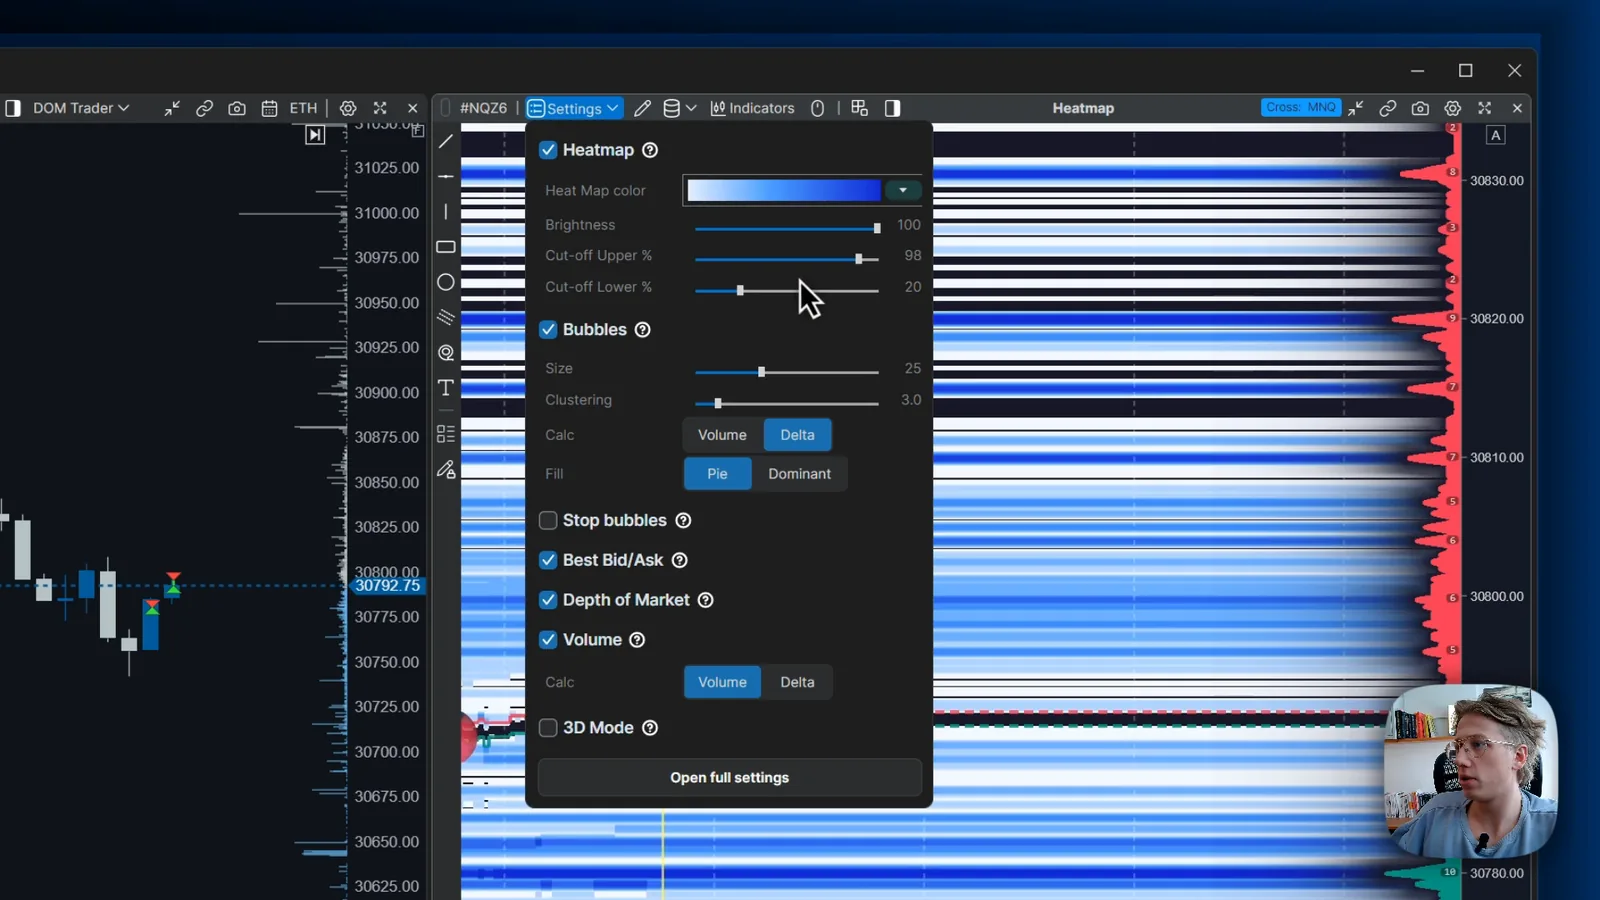
One more link matters here. To see the same price on the chart and on the heatmap, turn on the global crosshair for both and link the price axis, so the two stay in sync when you zoom. Save the heatmap as a template as well, then mark it as a favorite. With the execution chart and the heatmap running, this part took under ten minutes.
How do you set up the footprint?
Clone the chart, replace the settings with footprint settings, and scale the price levels.
I built the footprint on a second chart, named it and loaded the foundation template first, which removes the indicators. Then set the scale to 4 (more on that in the widgets section), turn off auto transform and open the footprint settings. I have a separate footprint masterclass for every setting, so here is the short version of what I use:
| Setting | Value |
|---|---|
| Content | Delta, mode delta profile |
| Borders | None |
| Color scheme | Heat map by delta, or plain delta with bid in blue and ask in red |
| Background of footprint | Transparent |
| Text color | One color for all text (ATAS X cannot color text by aggression); I use white, with auto size |
| Maximum level | On, with a colored border and bold text, so the point of control of each candle stands out |
| Value area, mode | Bar, so the coloring is not calculated across the whole visible region |
Footprint settings from the masterclass.
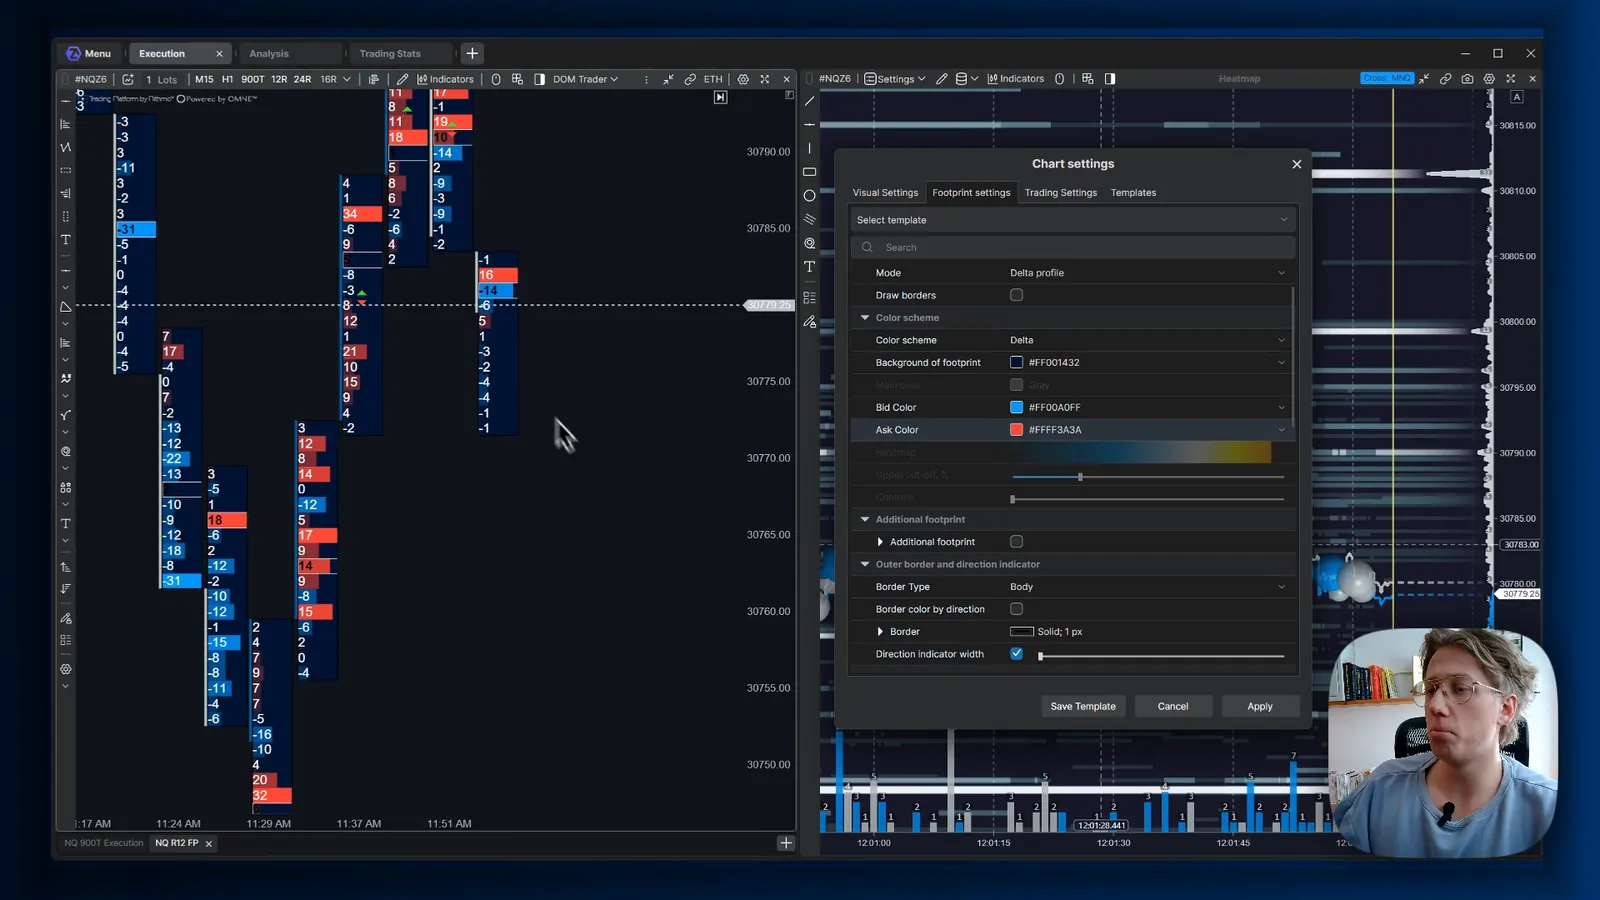
To highlight outliers, I added Cluster Search. One copy looks for buying delta: calculation mode delta, a minimum of 100 contracts at one level, visual mode ellipse in green, 70 percent object transparency, minimum size 10 and maximum 30. A second copy does the opposite for selling delta, with a maximum of minus 100 and a different color. Save each as its own template, and then save the whole chart (time frame, indicators and drawing objects) as one footprint template and mark it as a favorite.
On the execution chart I also use Big Trades, to see whether the largest prints push price or get absorbed.
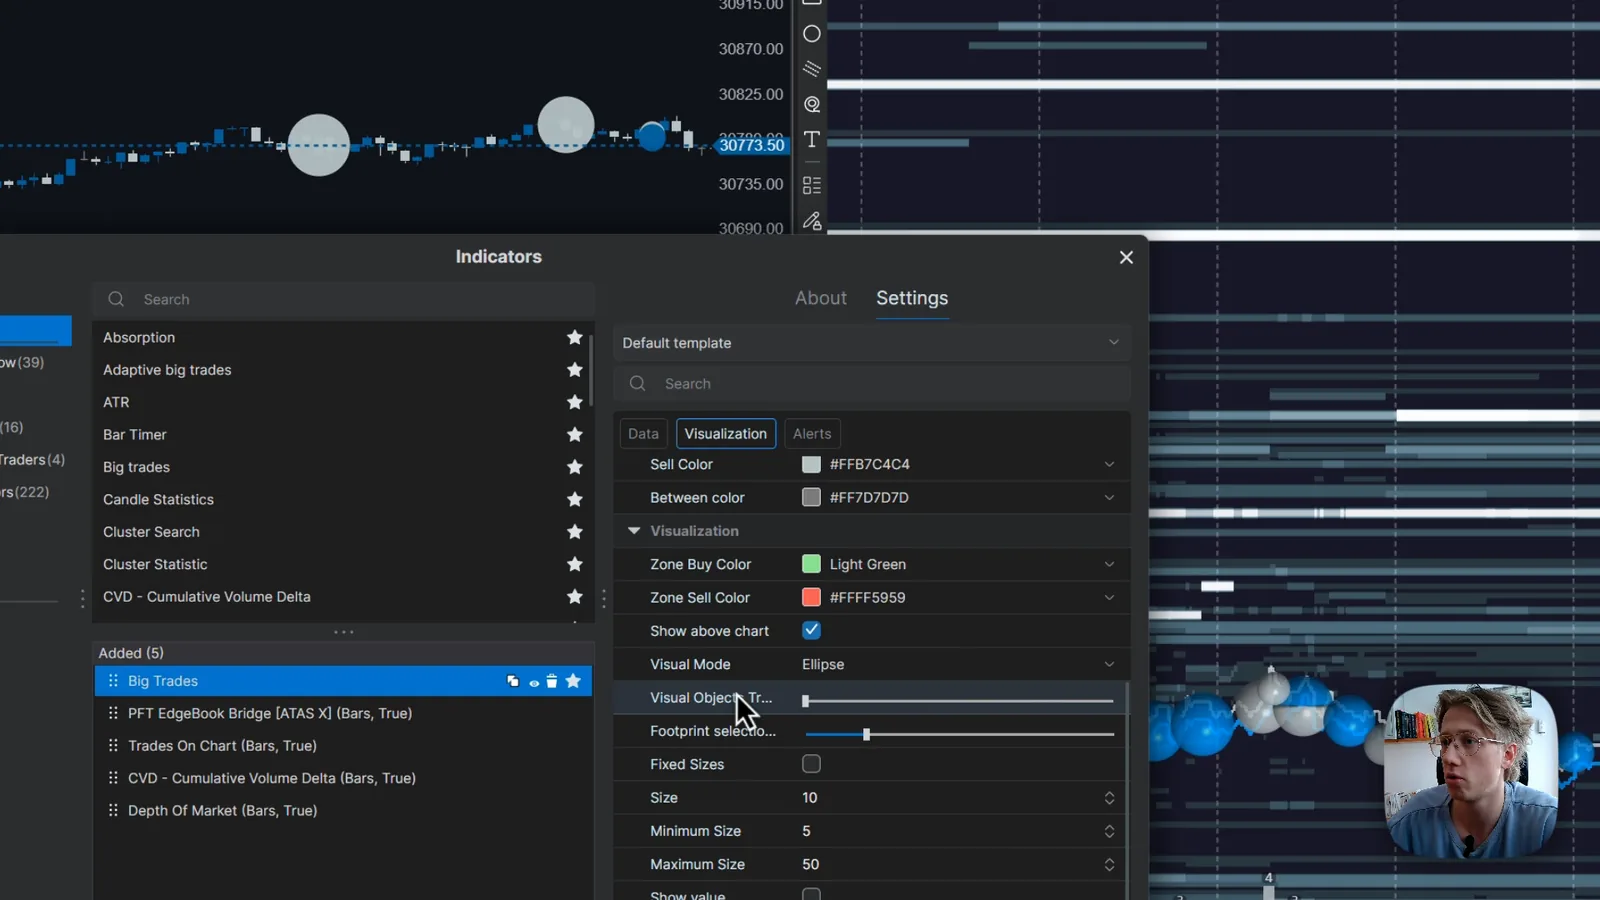
I set cumulative trades with a minimum volume of at least 120 for NQ, or higher, plus ellipses instead of rectangles and a size that follows the value of the order. Volume thresholds depend on the instrument, so check them again when you switch from NQ to ES.
How do you build the analysis tab?
Three charts, three time frames, each with its own volume profile period.
- A daily chart with a monthly volume profile, for the big picture.
- A one-hour chart with a weekly volume profile.
- A 15-minute chart with a daily volume profile.
Create the charts, load the foundation template, and clone as needed. Check the default loaded days for each time frame; for the 15-minute chart I use 30. Then add the Volume Profile and TPO indicator.
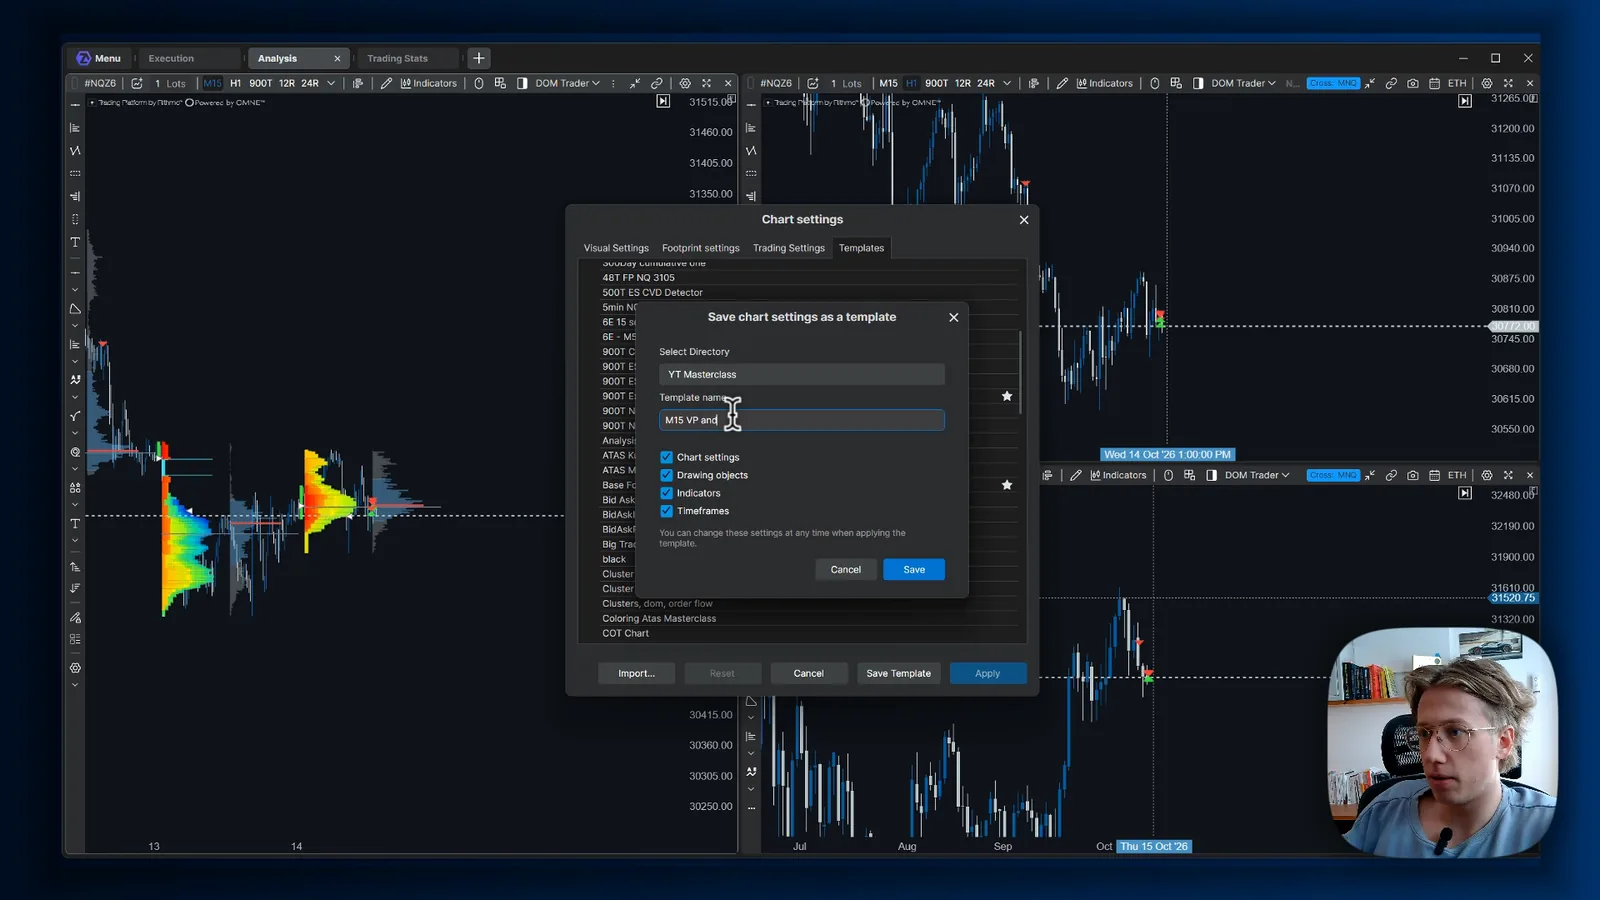
The settings are simple. The mode is profile, TPO or both. The external period decides what the profile covers: daily for the 15-minute chart, weekly for the hour, monthly for the daily chart. Auto proportion sizes it, profile type is volume (delta variants exist), and the initial balance is optional. For the look, I keep lines unextended, the area color transparent, the profile gray so I still see all the volume, and the value area in a blue area style. The point of control gets a width of two and a label, and it can be extended to the first touch. TPO adds options for single prints, letters and initial balance; on NQ the letters are hard to read once you zoom out, so they matter more on ES.
Because the volume profile indicator cannot save its own template, save each of the three charts as a chart template, for example one for the daily profile on the 15-minute chart. Otherwise you lose them.
Which other widgets are worth knowing?
Smart tape, smart DOM, bid/ask tape, options board, following manager, risk management and replay.
- Smart tape: a tape you can freeze and filter by volume, so you only see the big participants. I do not use it myself.
- Smart DOM, bid/ask tape and all prices: choose the instrument and customize the columns and common settings. All prices shows the volume at each price.
- Options board: the options chain for an instrument, with strikes and expiry.
- Following manager: ATAS X's copy trading. You pick a master account, and trades are mirrored to the follower accounts you add. I recommend copy trading by orders rather than positions, because with positions a follower can get filled late and end up with a worse entry. Limit orders reduce that slippage. Each follower has a ratio: a ratio of 2 on a larger account means two contracts where the master trades one. There is also a reverse positions option and notifications for order problems. Only one account should be your data provider, and you can keep it out of the copy group.
- Risk management: set a loss limit, a profit target, maximum trades per day and consecutive losses, with the option to include commissions. When a limit hits, ATAS stops trading or only notifies you, and it can lock you out, for example in reduce-only mode. There is an event log. If you tend to tilt, set it up before you trade, because it is built to be hard to undo.
The replay widget is easiest to use on your execution chart. Add it, then choose the market data type: candlesticks, or ticks and DOM level 2. If you want to replay with the heatmap or a footprint, you need ticks and DOM level 2, and in that mode the period cannot be longer than 24 hours. Pick the period, select the instrument and start. You can speed the replay up to 1000x, but you cannot go back in time. If the heatmap stays empty in replay, check that the instrument is enabled in the replay module list. In my video that was the missing step. The replay account lets you place trades with a stop loss and take profit, so you can test an idea.
The ATAS trading stats table exists too, but in my opinion it shows little. That is why I use PFT Terminal for the statistics, more on that below.
How do you place trades in ATAS X?
Open the chart trader with the T key and set up your stop loss and take profit first.
The chart trader panel shows the account, the cross-trading instrument, the quantity and buttons for market, best ask and best bid orders, cancel orders, reverse and close, plus your P&L. Switch on the SL/TP section, then edit the strategy. A simple strategy uses the same stop and target for every contract. A multi-level strategy gives each contract its own levels. In my example the take profit is 200 ticks and the stop loss 100 ticks, with a rule that moves the stop to break even after 100 ticks of profit, with a 5-tick offset above the entry price.
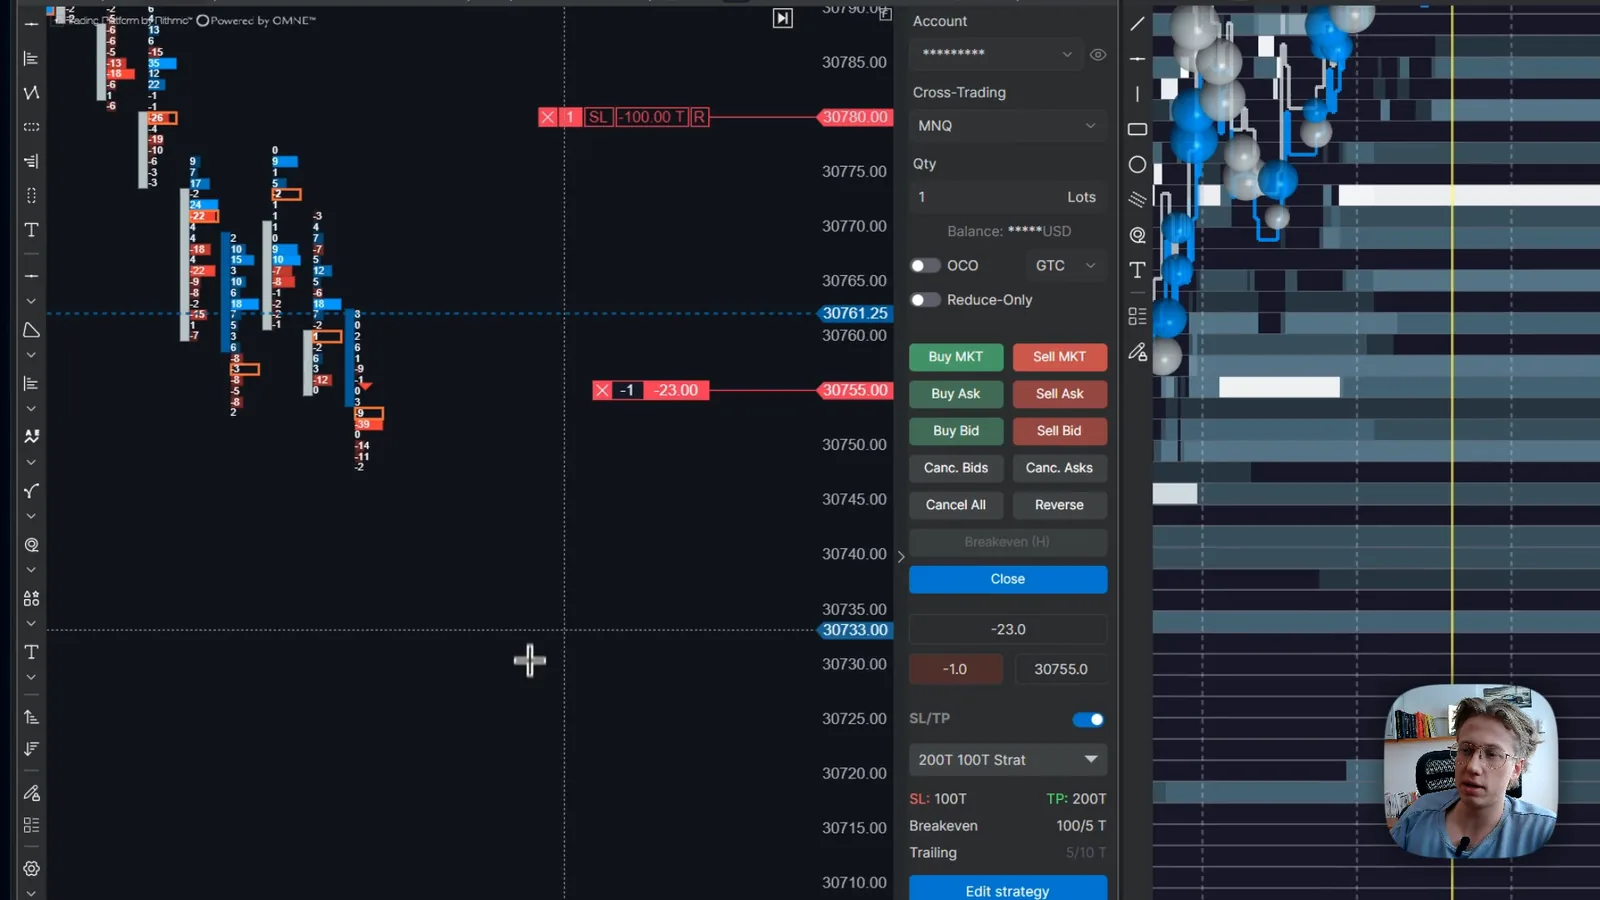
Once a trade is on, the stop loss, entry and take profit appear on the chart. If you move or lose them by mistake, click apply in the strategy, and the saved levels are placed again. I missed that feature for a long time. Check that the SL/TP toggle is enabled before you start trading.
To place limit and stop orders at a price, hold the space bar and click. A left click below the price places a buy limit and above the price a sell limit. A right click above the price places a buy stop and below it a sell stop. The Trades on Chart indicator then draws the entry, exit and result of the trade on the chart. If you have order routing problems or ATAS freezes, close positions in your broker's own platform, for example the one from Rithmic, or CQG.
The routine is the same every time: set up your platform and templates, check your stop loss and take profit, then use the panel, hotkeys or limit orders.
How do you journal your trades with PFT Terminal?
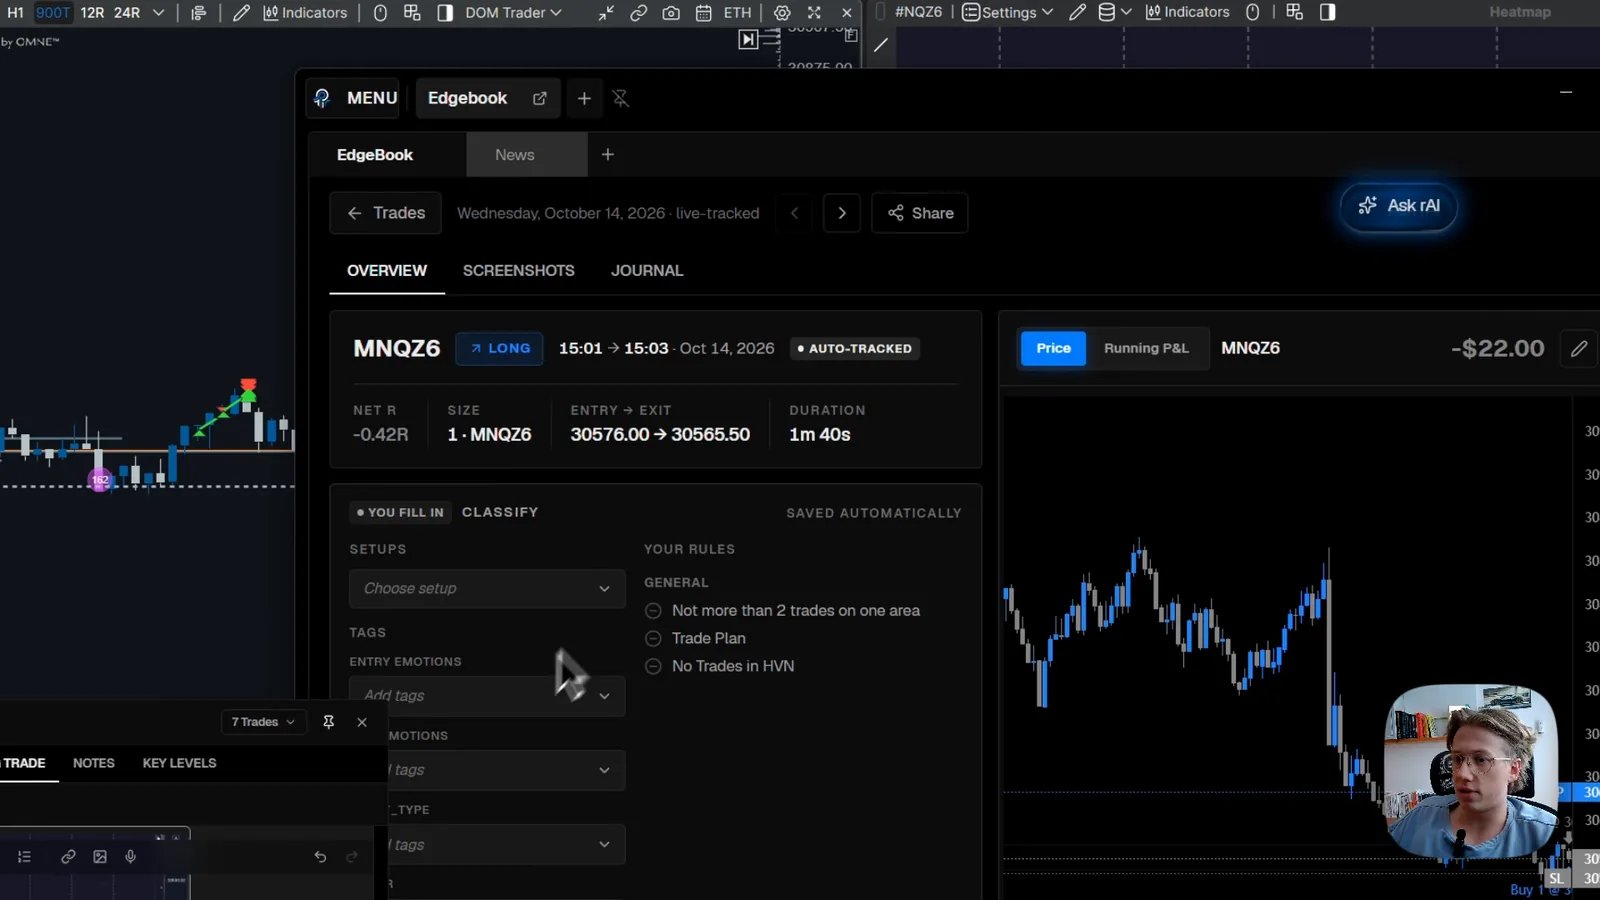
Connect the EdgeBook Bridge indicator, and your ATAS X trades land in the journal.
I built PFT Terminal because filling in spreadsheets after a trade is where most traders stop journaling. With the PFT EdgeBook Bridge indicator on the chart, a trade you take in ATAS X shows up in the terminal's trades tab, tracked automatically, with its entry, exit, size and duration. From there you add setup, emotions, rules and notes. PFT Terminal is free; the download page is linked below.
How do you save and reload your workspace?
Menu, workspaces, workspace management, add.
Once your templates are the way you want them, store the layout. Open the menu, choose workspaces, then workspace management, and add the current layout under a name you will recognize. ATAS reopens the application and the workspace is stored. When you close ATAS later, choose save and close if you changed something meaningful, or close without saving if not. To test it, restart ATAS X, select your workspace in the login window and click connect. A big workspace takes longer than you expect, so be patient. After loading, you should see the execution area with the footprint and heatmap, the analysis tab and the trading stats.
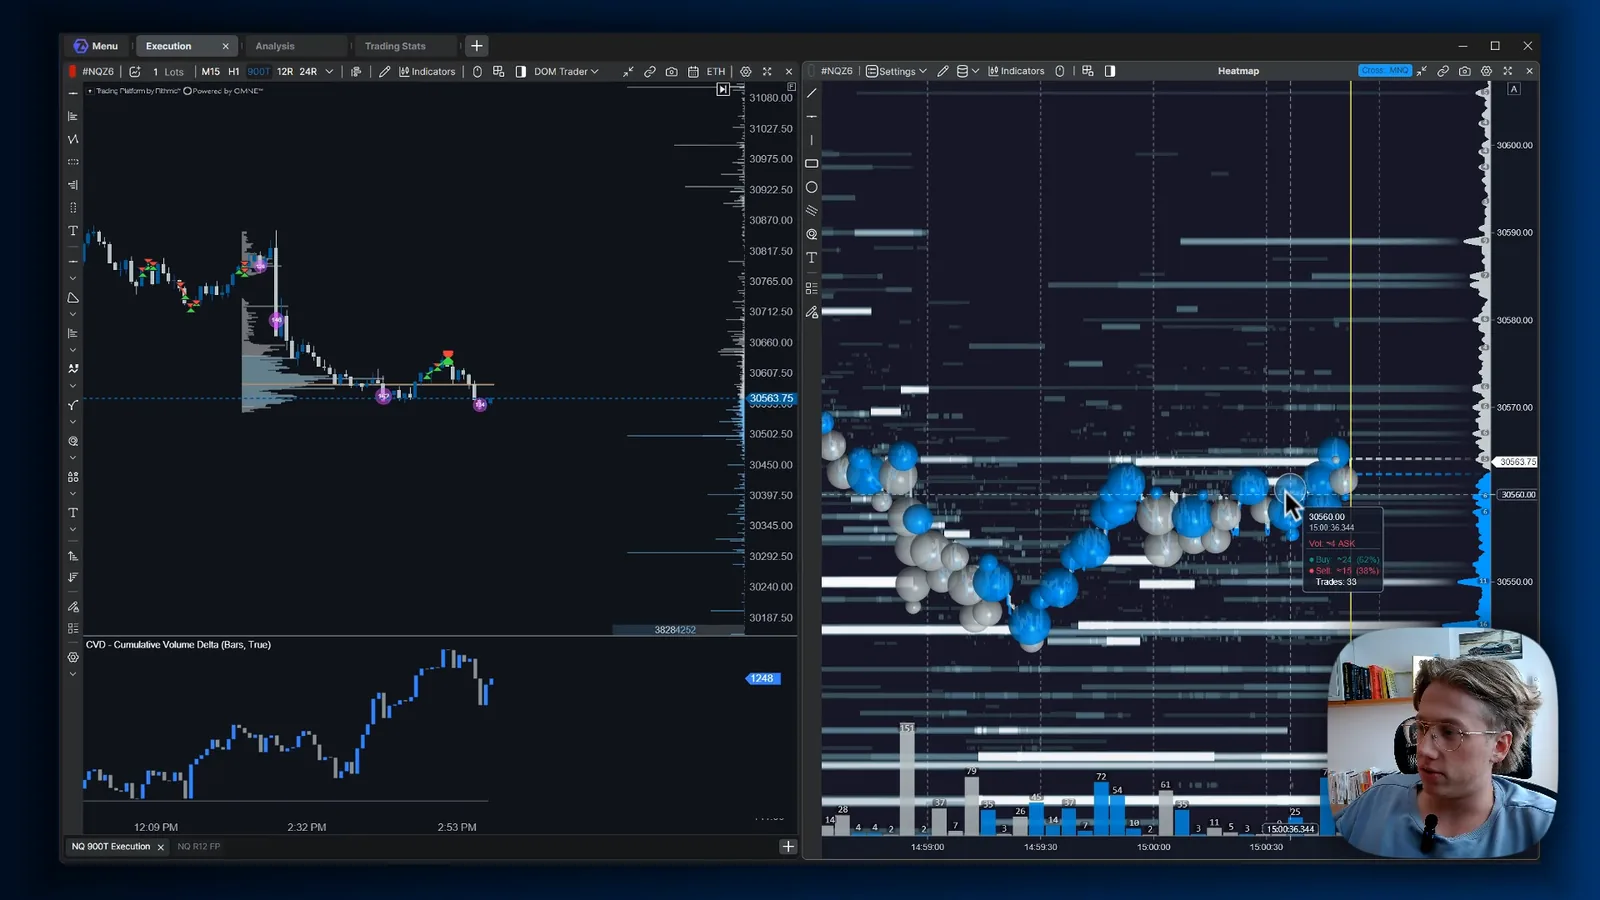
Delete a workspace in the same menu if you no longer need it. Your templates are stored separately from the workspace, so they stay available for the next build.
Get the workspace from the masterclass
Workspace files from our videos are collected on our resources page, so you can open them in ATAS X instead of rebuilding every chart by hand.
FAQ
Which ATAS plan do I need for real-time futures data?
At the time of recording, only Pro and Ultra could connect real-time futures data, while Plus came with a 15-minute delay. Check the current comparison on atas.net before you buy.
Does the ATAS X download include market data?
No. ATAS states that market data is connected separately. You need a data feed through a prop firm, a broker or, for crypto, an exchange.
Why should only one connection be the quotes provider?
Different data coming from different providers can cause issues. Keep one connection as the quotes provider and use the other accounts for trading only.
Why does my indicator not show in the indicator menu?
Check custom modules in the settings. If auto-loading of third-party modules is disabled, install the indicator manually there and click apply.
ATAS still shows the old version of my indicator. What now?
Use clear cache in the common settings, then restart ATAS.
Why did my volume profile settings disappear?
The volume profile indicator cannot save its own template. Save the whole chart as a chart template instead.
This article is educational content, not financial advice.