

How to Set Up a Workspace in ATAS
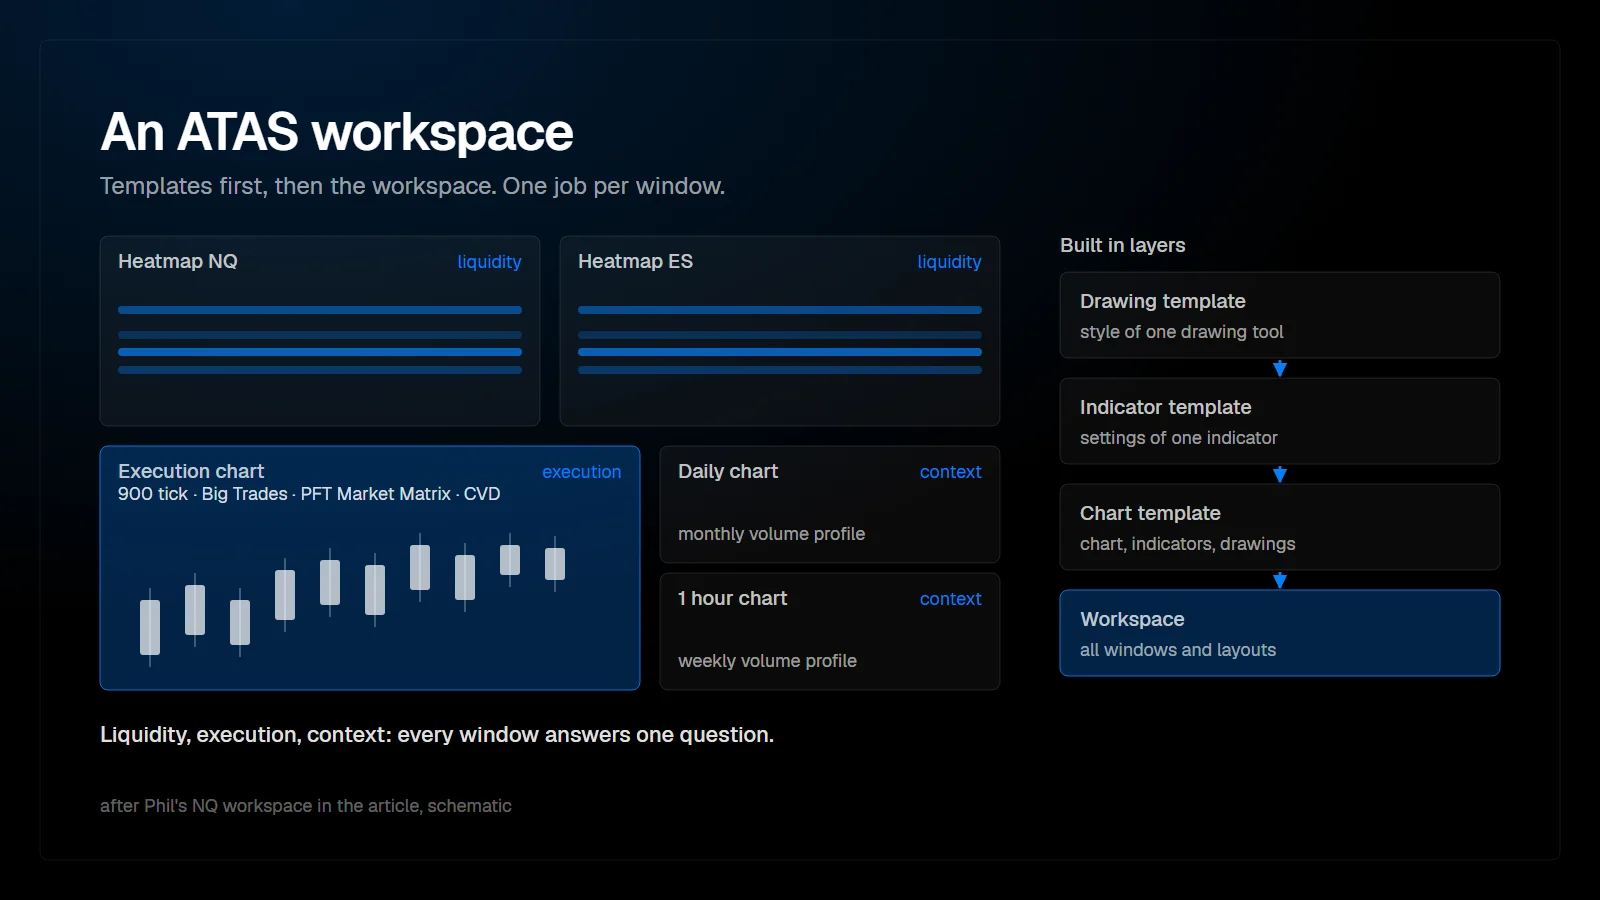
An ATAS workspace is the saved arrangement of all your windows: charts, heatmaps and DOM, with their instruments and positions. A good one is built in layers. Drawing templates, indicator templates and chart templates come first, then the workspace that holds them. Built once, it loads the same trading environment every session.
What is a workspace in ATAS?
A saved set of layouts and windows.
ATAS documents a workspace as a set of layers, also called layouts, and the windows placed on them. A chart template is a separate thing: it stores the chart type, the visual settings and the indicators of one chart. Templates are stored locally rather than inside a workspace, so every workspace on the same computer can use them.
| Building block | What it stores | Where it is used |
|---|---|---|
| Drawing template | The style of one drawing tool and the time frames it appears on | Every chart where the tool is drawn |
| Indicator template | The settings of one indicator | Whenever the indicator is added again |
| Chart template | Chart settings, footprint and trading settings, indicators, drawings and time frame | New charts and cloned charts |
| Workspace | All windows and layouts with their instruments | Loaded at start or from workspace management |
The building blocks of an ATAS setup, from the smallest to the largest.
What does a workspace look like after seven years of trading NQ?
Sparse. Every window answers one question.
Phil's own workspace in ATAS Classic, built over seven years of trading NQ, is organized around three jobs: liquidity, execution and context. He describes the path there as removing most of his indicators rather than adding new ones.
| Window | Setup | Job |
|---|---|---|
| Heatmaps for NQ and ES | 3D mode, blue bubbles for aggressive buyers, grey for aggressive sellers | Where liquidity sits, where it is pulled, where the next target is |
| Execution chart | 900 tick chart with Big Trades, PFT Market Matrix and CVD | Timing: bias of the day, accumulation zones, aggression |
| Daily chart | Monthly volume profile, opening and closing points, high volume nodes | Higher time frame areas of interest |
| 1 hour chart | Weekly volume profile | Weekly profile edges and rejections |
Phil's NQ stack as shown in the video. The ES stack uses the same layout.
Two details stand out. The Big Trades indicator is filtered so that only the largest trades appear, because the question is whether the biggest participants push price further or get absorbed. And the bias of the day comes from the PFT Market Matrix, so it does not have to be worked out by hand before every trade. The entry itself still waits for a location, such as a fake-out of an accumulation zone.
How do you save drawing templates?
Style the tool once, then save it under a clear name.
Our ATAS X walkthrough starts with the smallest building block. Drawing tools sit in the panel on the left of the chart and in the right-click menu under drawing objects. Tools marked with the star appear in the favorites toolbar, which saves a trip through the full list.
- Draw the tool, for example a highlight or a horizontal line, and open its settings.
- Set colors, text and text position.
- Choose the time frames on which the drawing should appear, for example on M5 but not on H1.
- Click save template as and give it a structured name, such as M5 AOI for a 5 minute area of interest.
- For a horizontal line that should appear across charts, activate the global setting and save the template again.
The naming habit matters more than it seems. After a few months there are dozens of templates, and a name that contains time frame and purpose is what keeps them usable.
How do you save indicator templates?
Adjust the indicator, then save its settings as a template.
Indicators are added through the indicators entry at the top of the chart or via right-click. After adding one, for example CVD, adjust its data and visualization settings and click save as template. Including the instrument in the name, such as main NQ, helps because thresholds differ between instruments. The next time the indicator is added, the template is one click away.
How do you save a chart template?
After drawings, indicators and chart settings are done, save the whole chart.
Chart settings cover the background, candle colors, crosshair, the indicator separator, footprint settings and trading settings such as one-click mode. Once they are set, the template dialog opens from the icon at the top of the chart or via right-click.
- Create a directory with select directory, for example one for execution charts, then name the template.
- Use a name that includes instrument, time frame and date, such as NQ M5 190926, so outdated templates are easy to spot.
- Choose what the template stores: chart settings, drawing objects, indicators and time frames.
- Set the template as default so new charts start with it, and mark it as a favorite for quick loading.
- To update it later, right-click the template and save to overwrite. Export shares it with another trader.
How do you save and load a workspace?
In ATAS X: menu, workspace, workspace management.
Build the workspace last, once all templates exist. In ATAS X, workspace management adds the current arrangement as a new workspace. Structured names help here too: separate workspaces for main charting, backtesting and screen recording keep each environment clean. Save writes changes into the active workspace, and loading another one switches the whole screen.
The workspace window offers load, add, save, delete, rename, copy, edit, export and import. Delete removes the workspace together with all its layers and windows. In ATAS Classic, the entry point has moved between versions, and the help documentation lists more than one path to it.
How do you share a workspace?
Through the settings folder, or through export and import.
In the ATAS X walkthrough, menu, settings, common settings opens the settings folder that contains the saved workspaces. Copy the workspace and send it; the other trader imports it through workspace management. For ATAS Classic, the help documentation names the folders %APPDATA%\ATAS\Workspaces_v3 for workspaces, with the extension .ws, and %APPDATA%\ATAS\Chart\Templates for chart templates. Close the platform before copying files.
How do you keep a workspace readable?
- One job per window: liquidity, execution or context.
- Remove anything that has not influenced a decision in weeks.
- Keep one fixed setting per tool, especially for a heatmap, so the picture stays comparable.
- Save templates before the workspace, and name everything by instrument, time frame and date.
- Keep a separate workspace for backtesting, so replay windows never change the live layout.
FAQ
Are templates part of the workspace?
No. Templates are stored locally and are available to every workspace on the same computer. The workspace stores the windows and layouts.
Can I move a workspace from ATAS Classic to ATAS X?
ATAS states that a workspace can be taken over from Classic, but the steps are not documented in detail, and ATAS X is not a full replica of Classic. Expect to rebuild some windows.
How do I make new charts start with my settings?
Save the chart as a template and set it as default. New charts and cloned charts then start from it.
What should a first workspace contain?
One execution chart, one higher time frame chart and, if the data feed includes depth, a heatmap. Add windows only when they answer a question the existing ones cannot.
This article is educational content, not financial advice.