

ATAS X Tutorial: How to Set Up ATAS X in Under 30 Minutes
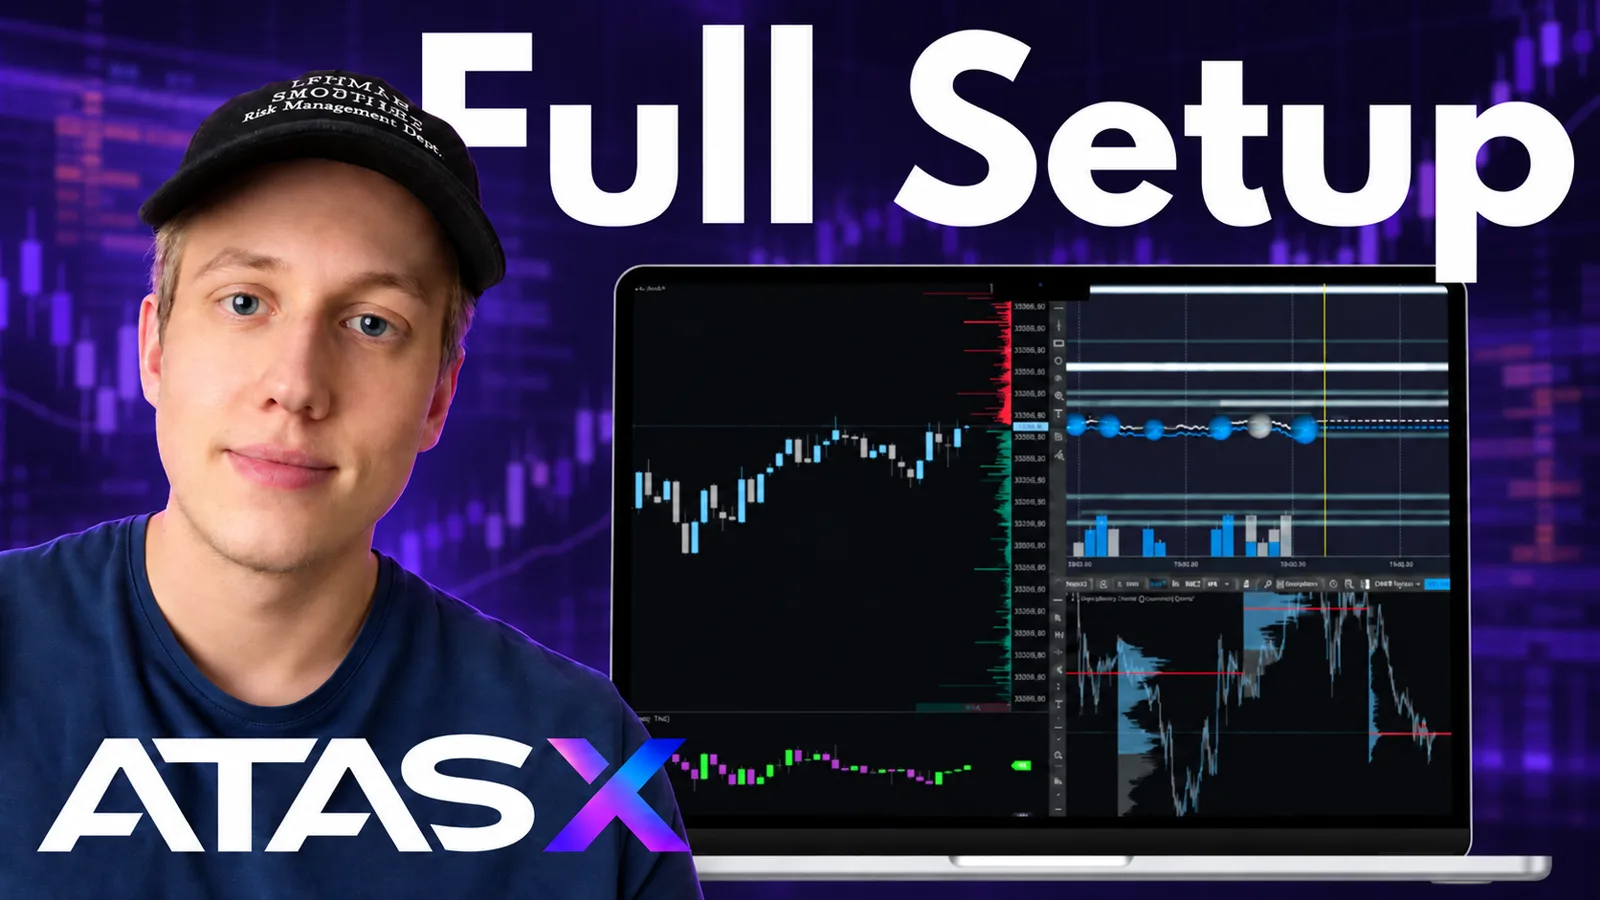
Setting up ATAS X takes about 30 minutes if the steps run in order: the right plan and a real-time data connection first, then common settings, chart, footprint, volume profile and heatmap templates, and finally one workspace that loads all of it at once. This ATAS X tutorial for beginners follows that order end to end, and the finished ATAS X workspace from the video is a free download on our resources page.
Which ATAS X plan do you need?
Pro or Ultra, if you want real-time futures data.
ATAS X sits on top of a regular ATAS subscription (Start, Plus, Pro or Ultra). Checked on atas.net's pricing page in September 2026: Start and Plus list real-time crypto data but only a 15-minute delay on futures data, while Pro and Ultra add the ability to connect real-time futures data. Plan names and their exact features change from time to time, so confirm the current comparison on atas.net before buying, and skip a purchase that only covers Start or Plus if futures is the market you trade. Once the account and plan are set, ATAS X downloads from the dashboard at my.atas.net, under Download ATAS X, in a build for Windows or Mac.
How do you log in and configure common settings?
Leave the server on auto, then set market depth, cross trading and the renderer before anything else.
The first login window asks for the server, your credentials, and whether to load a workspace. Leave the server on auto and skip loading a workspace for now; workspace loading is the last step in this walkthrough, once one exists. After logging in, open common settings and work through them before touching a chart.
| Setting | Value | Why it matters |
|---|---|---|
| Level 2 / market depth | 500 | Enough depth of market for footprint and heatmap analysis |
| Cross trading | Enabled | Needed to chart or trade an instrument such as MNQ from an NQ connection, or the other way round |
| Renderer type | OpenGL | Uses the graphics card, which keeps the heatmap and other renderers smooth |
| Time zone | Exchange time zone or your own | Sets the time shown on every chart's price axis |
Common settings used in this walkthrough.
One gap worth knowing about: at the time of this recording, ATAS X did not yet track commissions.
How do you connect real-time market data?
Add one connection for your broker or prop firm's feed, and keep only that one active.
ATAS X ships with a SIM connection enabled by default. For a live or prop-firm feed, delete or disable that SIM connection first, so only a single quote provider feeds the platform.
- Open connections and remove the demo connection if you plan to trade a real feed.
- Add a new connection and pick your data provider, for example Rithmic.
- Name the connection so it is identifiable later, such as the account name and size.
- Enter the login credentials your broker or prop firm sent by email.
- Pick the server your provider documents as nearest to you, and keep aggregated quotes enabled.
- Enable autoconnect, so the connection comes up automatically at start.
- Click apply and wait for the connection to show as connected.
How is the ATAS X interface organized?
As widgets you place on a grid of docking panels.
ATAS X is built from widgets: chart, heatmap, smart tape, order tables and risk management panels among them. Adding a chart widget loads a default template, with drawing tools on the left, the instrument selector and correlation overlays at the top, time frame and bar type controls, and access to indicators, templates and settings.
Any widget can be pulled out into its own floating window by dragging its title icon, and dropped back to dock it again. Tabs above a widget can be renamed, which helps once a chart has a fixed job, such as execution.
How do you set up your chart and save templates?
Set the visuals once, then save each layer as its own template.
Right-click a chart to open its settings. In this walkthrough the background becomes a darker two-color gradient, the crosshair gets a wider, more visible color, the grid is switched off, and new-session lines are set to transparent, which is the workaround when ATAS X has no direct off switch for something. Candle body and border colors are toned down from the defaults to keep the chart from being too bright, and axis font size is adjusted to taste. Click apply.
Configure time frame lets you add tick-based charts, for example a 900-tick chart, and set how many days load by default for each one. Mark the time frames you actually use as favorites so they appear in the header instead of the full list.
For trading settings, one-click mode is switched on, so holding the space bar with a left or right mouse click sends a market order straight from the price ladder without a confirmation window. Slippage is set to a small value, such as two ticks.
- Once chart settings, drawings and indicators for a chart are set, open the template dialog again and choose save template.
- Create a directory to keep templates organized, for example one folder for the whole setup shown in this walkthrough.
- Choose exactly what the template stores, such as chart settings and drawing objects, without the time frame, so one coloring template works across several time frames.
- Mark templates you reuse often as favorites for one-click loading.
How do you set up the footprint?
Turn on the volume profile inside the footprint, then add a second footprint layer for delta.
| Setting | Value |
|---|---|
| Content | Volume profile |
| Draw borders | Off |
| Color scheme | Solid, or heat map by volume, with a neutral coloring rather than the brighter default |
| Additional layer | Row-based positive/negative delta |
| Background | None |
| Max level, border text and colors | Off, for a cleaner read |
Footprint settings used in this walkthrough.
The upper cutoff on the color scale is pulled down from its default, so the coloring does not exaggerate contrast between ordinary and heavy volume. Portion settings are calculated per bar rather than on the visible chart, which keeps the footprint reading consistent while scrolling or zooming.
How do you add a volume profile to a higher time frame chart?
Clone the chart, switch its time frame, and add the Volume Profile and TPO widget.
Cloning the footprint chart carries its drawing and coloring templates over to the copy. Change the clone's time frame, for example to M15, adding it first if it does not exist yet. Add the Volume Profile and TPO indicator, set its mode to external and its period to daily, with auto proportion switched on; initial balance is optional and only useful if you trade around the opening range. Coloring in this walkthrough: a greyish profile line, a distinct color for the point of control text, and a brighter highlight on the value area, the band holding roughly 70 percent of the volume traded in that period. Candle bodies and the grid stay off, so the profile is the only overlay.
How do you add Big Trades and CVD?
| Setting | Value |
|---|---|
| Mode | Cumulative trades, auto filter |
| Minimum volume | At least 80 percent of one contract's typical size |
| Shape | Ellipse rather than a rectangle, with the traded value shown |
| Colors | Separate buy/sell colors, moderate transparency |
Big Trades settings used in this walkthrough.
The minimum volume threshold filters out everything except the largest prints, since the point is watching whether the biggest trades push price further or get absorbed at a level, not counting every trade on the tape.
CVD (cumulative volume delta) is added below the chart with default settings and no custom session, visualization set to candles with no scale, and coloring kept close to grayscale so it matches the rest of the chart rather than standing out with its own palette.
How do you set up the heatmap?
Clone a chart, replace the widget with heatmap, and set the correct instrument.
Clone an existing chart panel, right-click it and choose replace widget, then pick heatmap and the instrument. Watch the cross-trading label ATAS X shows next to the instrument, for example when charting MNQ from an NQ connection. Trading the wrong contract size because the wrong instrument was cross-traded is a real risk here, not a cosmetic detail.
| Setting | What it does |
|---|---|
| Brightness | Cut down so only the largest resting orders stand out |
| Bubble size and clustering | Based on volume and the dominant side |
| Depth of market shown | Best bid and best ask bubbles, plus the surrounding depth |
| Zoom XY, one-click | Both enabled, for fast zooming and one-click order placement |
Heatmap settings used in this walkthrough.
If the order book does not show, the connection is missing level 2 depth. That has to come from the broker or prop firm providing the feed, not from ATAS X itself.
How do you place trades and save the workspace?
Open chart trader with the T key, and set a stop-loss/take-profit template before the first trade.
Chart trader opens by right-click, open chart trader, or the T hotkey. It shows the account, a cross-trading toggle, and order type buttons for market, by ask, by bid, OCO and reduce only. The stop-loss/take-profit section below it needs switching on separately; edit strategy offers a simple single bracket or several separate ones, and a saved template avoids setting stops and targets by hand on every trade.
| Field | Value |
|---|---|
| Take profit | 200 ticks |
| Stop loss | 100 ticks |
| Breakeven trigger | 100 ticks, with a 5-tick offset above entry |
| Trailing | Optional, enabled per template |
Example bracket template used in this walkthrough.
Trades can also be placed directly on the price ladder by holding the space bar and clicking: left for a limit order below price, right for a stop order above price. The Trades on Chart indicator draws the entry and exit of a closed position on the chart itself, useful for a quick visual review after the session.
Once charts, footprint, volume profile, the indicators and the heatmap are set, open workspace management (menu, workspace, workspace management) and add the current layout as a new workspace under a name you will recognize later. Loading that workspace afterwards restores the entire screen in one step. Deleting a workspace removes it and everything placed on it, so keep templates, which live separately, as the reusable layer underneath.
FAQ
Do I need the Pro plan to use ATAS X?
You need an ATAS plan that unlocks ATAS X, and as of September 2026 that starts at Plus, but Plus only carries a 15-minute delay on futures data. Real-time futures data specifically requires Pro or Ultra. Confirm the current plan details on atas.net before buying, since ATAS changes its tariffs from time to time.
Why should only one connection be active?
Two active quote providers for the same instrument can create conflicting fills and confusing depth data. Keep the SIM or demo connection disabled once a live or prop-firm feed is connected.
What causes an empty order book in the heatmap?
Missing level 2 market depth on the active connection. It has to be enabled by the broker or prop firm providing the data feed, not configured inside ATAS X.
Can these settings be reused across instruments?
The chart and footprint templates apply to any instrument, but thresholds such as the Big Trades minimum volume are sized to one contract, so review them again after switching, for example from NQ to ES.
This article is educational content, not financial advice.