

PFT Terminal Masterclass: The guide in English
Step by step through all ten parts of the video series. Version: PFT Terminal 2.1.20, November 2026.
Quickstart: From trade to analysis
The shortest way in seven steps. Each step names the part where it is explained in detail.
- Install the terminal and sign in. Download the terminal from the "Downloads" section of the dashboard on the website and sign in with your account details. (Part 1)
- Switch on the Bridge. In ATAS, open "Indicators > Custom Modules", enable the "PFT EdgeBook Bridge" and add it to the chart you trade from. NinjaTrader and Sierra Chart have their own setup in the dashboard. (Part 2)
- Keep the terminal open and trade. Take your trade as usual. It appears in the terminal automatically, with entry, exit, size and screenshots. (Part 2)
- Take notes during the trade. Open the Live Desk, choose your setup and your tags, and write your thoughts in the trade note, typed or dictated. (Part 5 and Part 6)
- Look at the day. In the EdgeBook, open the Trade Tab and click the day in the P&L Calendar. You see the stats of the day, the Day curve (cumulative) and the Exit efficiency. (Part 4)
- Review the single trade. Click the trade at the bottom. There you find MFE, MAE, the values after the exit, the screenshots and your journal. (Part 4)
- Find patterns. In the EdgeBook, build a dashboard from widgets and filter by time range, instrument and account. Then use Ask rAI to see what works well and where your mistakes are. (Part 3 and Part 9)
If no trade arrives in the terminal: open Settings, then Import Trades, and check that it says "EdgeBook Bridge active". (Part 2)
Contents
- Part 1: Download, sign-in and overview
- Part 2: Getting your trades into the terminal automatically
- Part 3: The dashboard with widgets
- Part 4: The Trade Tab
- Part 5: Setups, tags and strategies
- Part 6: Live Desk, screenshots, voice notes and trade videos
- Part 7: Risk Guard and the Prop Firm module
- Part 8: Charting, News and Community
- Part 9: rAI and MCP (connect ChatGPT and Claude)
- Part 10: Settings and help
The images come from the videos and show the English interface. Names of buttons and menu items are written in bold, exactly as they appear on screen. You can change the language of the terminal in the settings.
Part 1: Download, sign-in and overview
What you learn: You download the PFT Terminal, sign in and find your way around. You add modules, arrange tabs and windows, and save your layout as a workspace.
Note: The videos and screenshots show the English interface. Names of buttons and menu items are written in bold, exactly as they appear on screen. Labels from the website and from ATAS are written in quotation marks.
Download the terminal
- Open the PFT page of the terminal. You find the link in the video description.
- Click "Get the terminal".
- If you already have an account with us, sign in. Otherwise click "Create account" and set up a new account.
- After signing in you are in the dashboard. There you find your account, billing, downloads and the area for referrals.
- Click "Downloads".
- Under "Pick your platform", click "Download" next to Windows.
Currently there is only a Windows version. The Mac version is coming later.
Prepare the trade import (Bridge)
For the terminal to record your trades automatically, you need an indicator, depending on your trading platform.
- ATAS: In the dashboard under Downloads, enter the email address of your ATAS account in the field and click "Get it". Afterwards you get the indicator in ATAS through the "Custom Modules" section.
- NinjaTrader: Download the indicator file in the dashboard. There is a dedicated video about it on the YouTube channel.
- Sierra Chart: Follow the instructions in the dashboard and watch the matching video on the YouTube channel.
Part 2 shows the setup for ATAS X.
First sign-in
- Start the installed terminal. You see the sign-in window.
- In the Email field, enter the address you used on the website.
- In the Password field, enter the same password.
- In the Workspace drop-down, you choose which layout the terminal starts with. The list always contains the built-in layouts and the entry Do not load a workspace. Once you have saved a workspace of your own (see Workspaces below), it appears there too. If you always start with it, you do not have to rebuild anything.
- Click Sign in.
Overview of the terminal
On the first start, the terminal offers a demo tour. The video recommends it so that you get a feeling for how the platform is meant to work. You can end it with Skip tour.
The whole terminal is built from modules. This is how you bring a module into an empty area:
- Click Choose a module.
- Choose a module: EdgeBook, Prop Firm, Charting, News, Community, Mentoring or Settings.
The EdgeBook is the journal. The menu contains more items:
- Click MENU at the top left.
- Settings and Workspaces open the respective windows. Both are covered in later videos.
- What's new shows the previous versions and what was added in the current version.
- Support & Feedback is for problems with the terminal.
- Help AI answers questions about the terminal.
- Demo starts the tour again.
Send support
- Open Support & Feedback.
- Under Topic, choose the type of your message: Bug, Support, Idea or Question.
- Write your message.
- Keep Attach terminal log switched on. This helps the team find the cause in the code and give you a solution.
- Click Send. The message goes to the team.
Use Help AI
- Open Help AI.
- Help AI is part of the Trader + AI plan. Until then it is shown with a lock in the menu. You have up to ten requests per account per day and 100 messages per month. The window shows how many questions are left today.
- Write your question, for example "How do I connect to ATAS X?".
- The answer tells you that you need to connect the EdgeBook Bridge. You find the link for it in the dashboard. There you enter your ATAS email address.
Account, version and Marketplace
At the bottom of the menu you see the account you are signed in with, your terminal plan, the current version and links to the social channels. You need the version when you have questions about a feature.
In the Marketplace you can upgrade your license. There you also see whether your AI is already connected, and which other indicators are available for ATAS X.
Free, Trader and Trader + AI
Which functions you can use depends on your plan. In the terminal, locked areas are shown as a preview with a lock.
- Free: the journal basics, for example the automatic trade import, the dashboard with the free widgets, and the Charting, News and Community modules.
- Trader: everything for your own journaling. This includes the Trade Tab, the Live Desk, notes, setups, tags and the checklist, MFE and MAE, screenshots and trade images, voice notes, trade recording, the Risk Guard, the Prop Firm module, sharing as PDF or image, and cloud sync.
- Trader + AI: everything in Trader, plus rAI, the connection of your own AI (MCP) and Help AI.
Most of what Parts 4 to 7 show needs at least Trader. Part 9 and Help AI need Trader + AI.
Modules, tabs and several monitors
Why: This is how you spread the terminal across several windows and monitors.
- Click the plus. It adds a new module. In the top bar, the plus adds a new tab.
- Choose Charting, for example. There you can switch between Openmarket and TradingView.
- In the header of the chart, click the icon that detaches the window (Detach to new window). The chart is now a window of its own. Drag it to another monitor.
- Right-click the tab and choose Clone module. This gives you several charts next to each other. According to the video, up to eight charts are possible.
- Hold the left mouse button on a tab and drag it to where you want it. When you let go, the charts sit next to each other.
- Right-click a tab and choose Rename. You can also double-click the tab and change the name, for example to the instrument you are analyzing.
- Click the x to close a module or a tab.
- With Open in new window or Open in new tab, you put a module into its own window or its own tab.
- With Dock back, you bring the window back. All charts are in one window again.
The EdgeBook toolbar
At the top, the EdgeBook has a bar with functions. Each one is explained in more detail in its own video. Here is the overview:
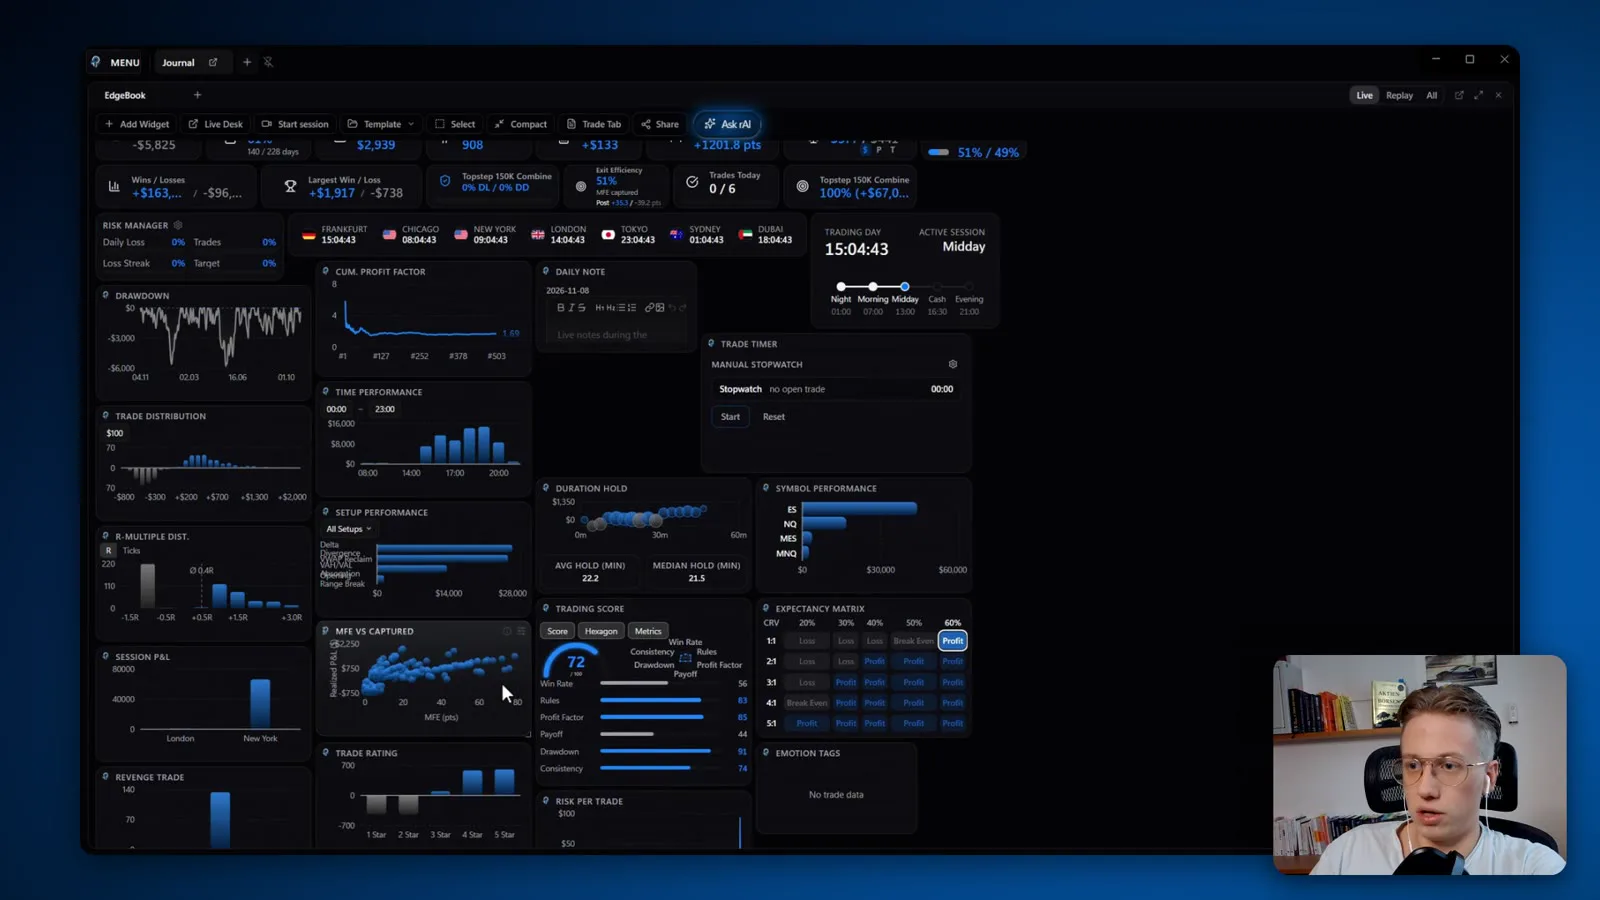
- Add Widget: The tiles you see are widgets. You choose what you want to track.
- Live Desk: Here you journal your trades while you are trading. There is a dedicated video for it.
- Start session: Starts the recording of your session.
- Template: Saves your widget arrangement.
- Choose Save current as template.
- Enter a name, or overwrite an existing template with Overwrite.
- Select: Mark several widgets and delete them in one go with Delete.
- Compact: Arranges the widgets more compactly.
- Trade Tab: Deep analysis of your individual trading days. There is a dedicated video for it.
- Share: Shares your EdgeBook report.
- Ask rAI: The built-in AI. According to the video, it is included in the Trader + AI package.
Workspaces
Why: A workspace saves your whole layout. This way you do not have to rebuild it every time.
- Build your layout. For example, add a module and drag it to where you want it. In the video, the Prop Firm is at the bottom and the Charting is at the top.
- Open the MENU and click Workspaces.
- Click Add. This saves your current layout immediately as a new workspace. The terminal first gives it a name like "Workspace 1".
- To give it your own name, double-click the entry in the list and type the name. In the video it is called "YT Masterclass". Later, Save overwrites the selected workspace with your current layout. The built-in workspaces cannot be overwritten or renamed.
- To switch, open Workspaces again, select a workspace, for example "PFT Showcase", and click Load. ("PFT Showcase" is a layout of the presenter in the video. The built-in layout in the terminal is called "PFT Default".)
- Open Workspaces once more, choose "YT Masterclass" and click Load. Your layout is back.
What comes next
You now know where to download the terminal, how to sign in and how to set up your layout. Part 2 shows how to get your trades into the terminal.
Video: Part 1, length 10:55
Part 2: Getting your trades into the terminal automatically
What you learn: You set up the EdgeBook Bridge in ATAS X so that your trades land in the terminal automatically. You check the Bridge, correct trades, enter commissions and import older trades.
Note: The videos and screenshots show the English interface. Names of buttons and menu items are written in bold, exactly as they appear on screen. This video shows ATAS X. For NinjaTrader and Sierra Chart there are separate videos on the YouTube channel. The options for them are in the dashboard on the website (see Part 1). Labels from ATAS are written in quotation marks.
Trade Tab and calendar
- In the EdgeBook, open the Trade Tab.
- There you see your setups, the areas where you take notes, and the calendar. The next video explains these areas.
ATAS: Switch on the PFT EdgeBook Bridge
Requirement: You have connected your ATAS email address with the EdgeBook Bridge (see Part 1).
- In ATAS, open Indicators > Custom Modules.
- Find the entry "PFT EdgeBook Bridge ATAS X".
- Make sure it is enabled.
- If you do not see the entry, look at the list of available modules further down. Click "Install" there. Afterwards it appears in the list.
- Click "Apply".
Bridge on the chart and settings
- The Bridge has to be on the chart you trade from. Open the chart and check under the indicators that "PFT EdgeBook Bridge" is in the list of added indicators.
- Open the settings of the Bridge. You can leave most values as they are.
- Check the version. It should be at least the one shown in the video, or higher, depending on when you watch the video.
- "Chart bars padding" is the number of extra bars that are saved before the entry and after the exit (default 20, possible values 0 to 500).
- Keep "Auto-screenshot on trade entry" switched on. Only switch this setting off if you do not want screenshots, for example for privacy reasons.
- Only switch on "Backtest mode (ATAS Replay)" if you want to backtest. Then the Bridge knows that you are backtesting. It only takes effect on the Replay account.
- Click "Apply".
Open a trade
- Before you enter, set your stop loss and take profit properly.
- Trade normally in your session and open a trade.
Your trade in the terminal
- Switch to the terminal.
- You see a notice: Trades are not included in the numbers because they are still open. This is fine. In the video, the notice says that one of five trades is not counted.
- In the screenshot you see the entry, exactly as your screen looked at that moment.
- You can classify your trade by hand: setups, entry types, ratings and checklists.
- Further down are the numbers for the trade: MFE (maximum favorable excursion, the largest move in your favor during the trade), MAE (maximum adverse excursion, the largest move against you), net P&L, R-multiple and the running P&L.
Why: MFE and MAE show you how far the trade moved for you or against you while you were in it.
No screenshot? Choose your monitor
If you do not see the screenshot, set the monitor.
- Open Settings and choose Screenshots.
- Under Auto-screenshot target, choose the mode Monitor(s).
- Click Choose monitor(s)….
- Select the monitor the screenshot should come from. In the video it is Monitor 1.
- Check that this monitor is enabled.
The terminal has to be open while you trade. Otherwise the screenshots are not captured.
Break-even and closing the trade
- In the video, the trader moves the stop to break-even because of his strategy. The trade keeps running.
- Close the trade when you want to exit.
Result in the terminal
- Switch to the terminal and open the trade.
- You see the entry and exit on the chart. In the video, there are 200 bars before the entry.
- At the top you can look at the running P&L, which shows how the P&L developed during the trade.
- The terminal captured everything automatically: the right instrument, entry time, exit time, net result, size, entry and exit.
- You can check the screenshots and write something in the journal. The journal is covered in the Live Desk video.
Check the Bridge and edit a trade
Why: You see whether journaling is running and all trades arrive.
- Open Settings and click Import Trades.
- At the top it says "EdgeBook Bridge active · last event" followed by the time of the last event. Then journaling is working right now.
- If there is a problem, for example wrong data for the entry or exit, open the Trades section in the settings.
- Find your trade and click the pen icon.
- The Edit Trade window opens. Correct the values by hand.
Commissions
According to the video, ATAS X currently does not provide commissions. You enter them yourself.
- In the settings, open Commissions.
- The instrument you trade is captured automatically and is listed.
- Under Round-turn USD per contract, enter your fee. In the video it is 2 dollars per round turn.
- The terminal updates the trades that were already imported. Afterwards you see in the trade the gross result of about 81.50 dollars and the fee of 2 dollars.
Assign a trade to an account
- In the settings, open the Trades section.
- You see which account a trade belongs to. In the video it is a demo account with the source ATAS X.
- One column shows the number of screenshots taken.
- To assign the trade to a different account, change the account in this list. You can also change it with the pen icon in the Account field.
Import ATAS history
- In the settings, open Import Trades.
- Click the ATAS import. The window is called Import ATAS history.
- Under Source, choose ATAS X, ATAS Classic or Both.
- Under Range, choose the period with Today, Week or All.
- In the list, deselect the trades you do not want to import.
- Click the import button at the bottom, for example Import 12 trades. It shows the number of selected trades.
Imported trades have no screenshots.
Instruments
The terminal normally recognizes your instrument on its own. If a mistake happens, you can add an instrument by hand.
- In the settings, open Instruments.
- Click Add instrument.
- Enter the symbol. Use the root symbol without the contract month, for example "MNQ", not "MNQU6".
- Enter the Tick size, which is the smallest price step. In the video, the example is 0.25.
- Enter the Tick value ($), which is the dollar value of one tick. In the video, the example is 1 dollar.
- Add the instrument. You can delete it again later.
According to the video, users have hardly had any problems with adding instruments so far.
Post-MAE and Post-MFE
Why: These two numbers show how far the trade would have moved for you or against you after your exit. In the video, they are two of the most important numbers for the trader.
You set how long after the exit the measuring continues:
- In ATAS, open the settings of the Bridge.
- Find "Post-exit window (minutes)". In the video, the value is set to 30 minutes. This is also the default. The setting "Post-exit tracking enabled" must be switched on for it to work.
- Change the number to fit your style. You can enter 1 to 240 minutes. If you hold positions longer, for example as a swing trader, use a higher value, at least 120 minutes (two hours), up to the maximum of 240 minutes. The higher your time frame, the higher the number. If you are a scalper and only the last minute matters to you, use a very small value, for example 1.
- Click "Apply".
Ghost trades: reset the replay state
Sometimes a so-called ghost trade appears, which is a trade that never happened. This can happen, for example, when the exit of one trade should at the same time be the entry of another.
- First reset the replay state of the Bridge. In the settings, the entry is called "Reset replay state".
- Click "Apply". Everything is then reset in the background.
- Also delete the previous trade.
What comes next
You now know how your trades get into the terminal automatically. Part 3 shows the widgets of the EdgeBook that you use to analyze your trades.
Video: Part 2, length 11:22
Part 3: The dashboard with widgets
What you learn: You build your own dashboard from widgets in the EdgeBook. You filter the numbers by time range, instrument and account, save your layout as a template and switch between Live and Replay.
Note: The videos and screenshots show the English interface. Names of buttons and menu items are written in bold, exactly as they appear on screen.
Widgets are the tiles that show your trading numbers. They are built so flexibly that every trader can pull in exactly the numbers they want to see.
Free or Trader: which widgets you get
- Many widgets are not available in the Free version.
- If most widgets are shown locked (as a preview), you need the Trader plan.
- You can only have one EdgeBook tab open at a time.
- The widgets only exist in the EdgeBook itself. The EdgeBook is the whole journal.
Add widgets
- In the bar, click Add Widget.
- In the window, choose Remove all if you want to start from zero.
- You see two groups: Stats and Charts.
- Click Add all to see all widgets at once.
- If widgets lie on top of each other, drag one to a different place.
Build your own dashboard
- Drag each widget to the place you want. Grab it at the top edge and move it with the mouse.
- To make a widget bigger, drag one of its four corners.
- Right-click a widget. There you set the Content size, which is how big or small the content should be.
- With Remove widget, you take a widget out again.
Recommendation from the video: First decide on your layout. For example, the EdgeBook on the left and the Prop Firm on the right. Then make the widgets smaller with Compact and drag them to the places where you want to see them.
Preview and arranging
Why: You see what a widget looks like before you add it.
- In the widget selection, move the mouse over a widget. You see a preview.
- The Stats group contains simple basic numbers, for example Avg Win, Avg Loss, Win Rate, Net P&L and Profit Factor.
- The Charts group contains more advanced widgets, mostly curves.
Filters
With the filter, you decide which trades a widget evaluates.
- In the widget, click the filter icon at the top.
- Under Time Range, choose a range or Custom for your own period.
- Under Instrument, choose the instrument you want to see.
- Under Account, choose one or several accounts. In the video, you choose for example the demo account, the sample account or both.
- If you take an account out, the numbers change immediately.
If you move the mouse over the icon on the left in the widget, you see what this widget measures.
Sync all widgets
Why: You see not only the win rate but all the other numbers for the same account.
- Open the filter of a widget.
- Switch on Sync all widgets.
- Now change the account, for example. All widgets follow.
- If the switch is off, only the widget in which you change the filter changes.
- Afterwards, set the filter back to All.
Save a layout as a template
Why: You can use a template in all workspaces. It is a general layout.
- Build your layout and click Compact.
- Click Template and choose Save current as template.
- Enter a name, in the video "YouTube Masterclass", and save.
- If you want to replace an existing template, use Overwrite. If you want a new one, save it under a new name.
- Click another template and you see a different layout.
- With Import and Export current, you can share templates with others.
Replay or Live
Why: If you backtest in replay in your trading platform, you see those trades separately.
- At the top right of the EdgeBook tab, next to the icons for detaching and maximizing, you find the toggle Live / Replay / All. Live shows your real trades (this is the default), Replay only the trades from ATAS Market Replay, and All both together. Switch the toggle to Replay.
- You then see your replay trades. In the video there are none yet.
- Switch back to Live to see your live numbers again.
Backtesting is possible through the terminal.
Remove, arrange compactly and select
- Right-click a widget and choose Remove widget to delete it.
- Compact arranges all widgets as compactly as possible.
- If you only want to delete some widgets: Click Select and mark the widgets. Then click Delete.
- You can track whatever you want, for example long versus short in the equity curve, News Watch, the Calendar and your tags.
Tag Performance
- Add the widget Tag Performance.
- It first shows Pick a category.
- Choose a category, for example Market environment.
- You then see the values for each tag of this category.
You create the categories yourself in the settings. Part 5 shows how.
What comes next
Part 4 covers the Trade Tab.
Video: Part 3, length 7:58
Part 4: The Trade Tab
What you learn: You open the Trade Tab and read the P&L Calendar. You look at the stats of a day, filter trades by account, setup and tags, and analyze a single trade.
Note: The videos and screenshots show the English interface. Names of buttons and menu items are written in bold, exactly as they appear on screen.
The dashboard shows you how your trades perform overall. The Trade Tab shows you each individual trading day.
Open the Trade Tab
- Open the EdgeBook.
- In the bar, click Trade Tab. All categories of the EdgeBook are there.
- To get back to the dashboard, use the Dashboard button.
- The toggle Live / Replay / All stays at the top right of the EdgeBook tab (see Part 3), also in the Trade Tab.
P&L Calendar
The P&L Calendar is a short overview of your individual days. You see how well or how badly they went.
- At the top are the monthly values: Monthly P&L, Trading days and Trades. The stats for the individual days come with them.
- Move the mouse over a day. A small window appears with a short analysis.
Live Desk, session recording and sharing
In the header of the P&L Calendar, next to the View selection, you find three functions:
- Live Desk: Opens the Live Desk.
- Start session: Starts the recording of your session.
- Share: Shares your month as a Calendar as PNG image, as a Calendar as PDF (landscape) or as a Trade report….
Setup analysis, checklist and journal
Below the calendar you find more areas.
- Setups · November 2026: The setup analysis. You create the setups in the settings. The next video explains this.
- Checklist: Here you see the evaluation for Bias Correct, for the higher time frame (HTF Context) and for whether you followed your rules (Rule Compliant).
- Below that is the area for the journal. There you write down your thoughts: the pre-trading plan, emotions, thoughts during the trade and more. You can also paste text that you dictated beforehand.
Customize the journal sections
- Click Customize sections.
- Remove the sections you do not need. In the video, these are for example Notes and the self-created section "Market Regime".
- If you only want to write for the pre-trading plan, leave only that section, or add it with Add section.
- In the editor, write what you want to record for this section. The editor supports rich text.
Stats of a day
- In the calendar, click a day.
- You see the stats for this day, for example Win-Rate, Profit Factor, Ø Win, Ø Loss, Best and Worst.
- Click Show stats and then Add all. You see a deeper analysis for this day.
Day curve and exit efficiency
- The Day curve (cumulative) shows how your result builds up over the day.
- Exit efficiency shows how much of what was possible in the trade you took with you. Move the mouse over a point. In the video it says 79 percent. This means you reached 79 percent of the maximum that was possible in the trade. You left 21 percent on the table.
- For Exit vs. best possible, move the mouse over a point and you see the values of the trade in ticks. In the video it is a short trade. It made 84 ticks. The best possible was 98 ticks, and the worst possible value was 20 ticks. Left on the table shows 14 ticks. So the result is the best possible minus what was left on the table.
Post-exit MFE and MAE
- For Exit vs. best possible, switch from In trade to After exit.
- These are not the values from inside the trade. They show how far the price moved for you or against you after your exit.
Why: You see how much more you could have made or how much more you could have lost. These are MFE and MAE after the exit.
Trades of the day
- At the bottom of the Trade Tab are all trades of the day. You also see them cumulated in the curve at the top.
- Click a trade. You get to the view of the single trade.
- There you see the entry screenshot, the exit screenshot, net P&L, R-multiple, Post-MFE, Post-MAE, MFE, MAE, exit efficiency, fees and all tags.
- You assign the tags later in this window or in the Live Desk.
Filter by account and review any day
If you use several prop accounts or several live accounts, you filter by a specific account.
- In the header of the calendar, click the account selection next to View:. It only appears once you have more than one account.
- Choose the account you want to see. In the video it is the demo account, the sample account or both.
- Click an account again to deselect it.
- You now see the numbers for this account. At the top of the calendar you see how much you made in each month.
- Move the mouse over a day to see what was possible on that day and what the trades looked like.
- Click the day. At the bottom you see the net result, the stats and what you wrote down for this day. You can also reach your trades from there.
Filter by setups and tags, add a trade
- Above the trade list you find filters. You can filter by setups, for example, in the video Delta Divergence or VAH/VAL Absorption.
- With Win & Loss, you choose whether to see only wins or only losses. If there are no losses in the chosen setup, the list stays empty.
- Use All setups to show everything again.
- You can also filter by emotions, entry type and other tags. You create these filters yourself in the settings, under Tags, Strategies and Setups. The next video shows this.
- To add a trade by hand, click Add Trade in the header of the trade list, at the top right next to the switch between list and gallery. You can enter it for this day or for another day.
Single trade analysis
- At the top you see a short overview: instrument, direction, entry, exit, day, net R, size, entry and exit as prices, and the duration.
- If ATAS or your trading platform was open during the trade and stored data, you also see the running P&L.
- You see the entry and exit screenshots.
- You see MFE, MAE, Post-MFE and Post-MAE. Why: This shows you what you can improve about your trades. In the video, it shows the trader that he closes trades too early.
- In the Screenshots tab, you find the entry, exit and manual screenshots you took.
- In the Journal tab is everything you write down for this trade.
What comes next
Part 5 shows how you create your own setups and tags. With them you can record almost everything and analyze it in depth.
Video: Part 4, length 8:25
Part 5: Setups, tags and strategies
What you learn: You create your own setups, rules and tags and use them to journal a trade in the Live Desk. You create strategies, assign trades to them and see why tagging pays off for later analysis.
You set everything up by your own rules here. Some names in the video, for example tag categories and journal sections, were created by the trader himself. That is why they appear in the text exactly as you see them in the video.
Where to find setups
- Open the MENU and then Settings.
- Click Setups.
Order: First create all your setups and tags. Only then can you backtest properly or journal live.
General rules
- In Setups, open the area General rules (every trade).
- Write a rule in the field, for example: do not trade after the first 15 minutes, or after three losses in a row leave the market and end the trading day.
- Click Add. The rule is created.
- Create more rules in the same way.
Later you see the general rules in the Live Desk, with every trade.
Create a setup: colors, entry and exit rules
- Under the rules, write a setup name in the field and click Add. In the video there are already examples.
- Change the color of a setup so that you recognize it faster.
- For a setup, click Rules. Here you define the Entry rules for this setup. Click Add for each rule.
- Then define the Exit rules.
- You can also create Risk rules.
In the video, the example is "Delta Divergence".
Tags
With tags, you mark whatever you want. For example the market environment, which news was released, your emotions at entry and at exit, your emotions during the trade, or mistakes, for example when you closed trades too early.
- In the settings, click Tags.
- The tags are sorted into categories, for example Market environment, Entry type and Error. In the video there are also the categories "Entry Emotions" and "Exit Emotions", which the trader created himself.
- In a category, enter a tag name and click Add. In the video, examples for the exit emotion are "satisfied" and "relieved".
- With Pick color, you change the color of a tag.
- With Rename category, you change the name of a category.
After that, you can tag live or in replay during your trades.
Backtest with setups and tags
Why: You see what tagging looks like during a running trade.
- In ATAS, switch on the backtest mode of the Bridge and click "Apply".
- Choose the period you want to backtest and start the replay.
- Increase the speed if you need to.
- Open the Live Desk. It always stays in the foreground.
- Choose the day. In the video it is November 5.
- Wait until a trade is open. It appears in the Live Desk and in the trade area of the terminal at the same time.
Journal a trade from the Live Desk
- In the Live Desk there is a field for the Trade note. You can use it for writing or for speaking. For speaking, click the microphone icon in the bar of the note field (tooltip "Dictate (local speech-to-text)"), or right-click in the Live Desk and choose Dictate (voice). Both only work when Voice notes are switched on in the settings (see Part 6).
- You can leave the Live Desk open during the trade and, for example, record videos at the same time. Speak your thoughts and emotions.
- End the dictation by clicking the microphone icon again (tooltip "Stop & transcribe"), or by pressing the dictation hotkey again. The terminal then transcribes the spoken text and writes it into the note. In the video, the end of the dictation is called "Finished". There is no button with this name in the terminal.
Why: The more precisely you maintain setups and tags, the deeper the analysis of each trade is. You see why some trades work and others do not. The AI rAI is built around this concept: tags, journaling and data that is as precise as possible. This lets it find patterns in your trades and in your behavior.
Setup, emotions and rules in the trade
In the Live Desk, you fill in the following while you are in the trade:
- The Setup. In the video it is Delta Divergence, the setup created earlier.
- The Tags: Entry Emotions, Entry Type, Error, Exit Emotions and Market Environment.
- Bias and HTF Context.
- Your Rating.
- Your rules. There you see the general rules and the rules of the chosen setup.
The more you fill in, the more precise the answers you get later.
When you are done with the trade note:
- At the top of the Live Desk, open the trades list. The button shows the number of trades, for example 3 Trades. The list contains your open and closed trades.
- Click the trade once more. You are then back in your normal view with the journal sections: Pre-Trading Plan, During Trade and, in the video, the sections "Emotions" and "After Trading Analysis", which the trader created himself.
- After closing, you see the day. In the video it is November 5 in Replay, not in Live.
The Strategies tab
Besides setups and tags, this is one of the most important areas for the trader in the video.
- Open Settings and click Strategies.
- A strategy is not the same as a setup. You can create setups for different strategies.
- All widgets in the dashboard can be displayed and journaled per strategy.
Example, a replay strategy:
- Type the name "Replay" into the field for a new strategy and click Add. In the video there is one trade in it.
- Open the rules field of the strategy (the document icon next to its name) and write down the rules of the strategy. The more precisely you record them, the better rAI can analyze your thought process later.
- Click Save.
Strategy dashboards
- Click the name of a strategy to make it the active one. The dashboard now shows the numbers of this strategy, and new trades are filed there. For the replay strategy, the dashboard in the video shows no trades. There is only one trade in it.
- Activate a different strategy, in the video "Opening Drive" with 53 trades and clearly defined rules. You see a completely different dashboard.
- To add trades, click the pencil icon on the strategy (tooltip "Choose which trades belong to this strategy"). The window Assign trades opens, with the name of the strategy in its title.
- There you see all trades of your database that are stored in the PFT EdgeBook. Choose the trades that belong to the strategy. The column In shows for each trade whether it is in the strategy.
- Every click takes effect immediately, there is no extra confirm button. The window shows how many trades are in the strategy. Close the window with the x. In the video, the number goes from 53 to 55 trades.
With Choose all, you select all trades. You choose a period with Choose time frame.
Backtest a strategy
- Create the strategy and give it a name.
- Write down the entry and exit conditions and the rules.
- Go back to your backtesting and continue. In the video there are 55 trades at the start.
- Finish a trade.
- Then open the strategy in the settings. There you now see 56 trades.
You can see at any time how many trades are in the open strategy. All trades are saved and can be found in the Trades section of the settings. There you can filter them by day and instrument and assign them to an account, or to a strategy through the Strategies tab.
Why tagging pays off
Based on your strategies and tags, you can ask rAI:
- What is working well?
- Where do you make the most mistakes?
- Which patterns do you see in every trade?
Example from the video: With every breaker trade, you write down whether you trade with the buyers. For this, you create a tag "trade with the buyers". If you record this consistently, you can find out that your trades work better when you trade with the buyers. This gives you deep insights.
What comes next
The next video continues with journaling during a trade.
Video: Part 5, length 11:24
Part 6: Live Desk, screenshots, voice notes and trade videos
What you learn: You set up screenshots, voice notes and trade recording. After that, you journal with the Live Desk while you are in a trade, and you review the trades and their videos later in the Trade Tab.
The videos and screenshots show the English interface. Names of buttons and menu items are written in bold, exactly as they appear on screen.
What this is about (0:00)
The idea behind the journal: You do not write after the trade, when your emotions have built up, but during the trade, while you are still neutral. This way you analyze the setup soberly. There are three building blocks for this:
- The journal in the Live Desk, while you are in a trade.
- Automatic screenshots at entry and exit, and screenshots whenever you want.
- A video that runs along during your session. Later it is cut down to the individual trades.
Before you start, you adjust a few things in the settings.
Screenshot settings (1:21)
Open MENU, then Settings, then Screenshots.
- Switch on Screenshot hotkey. Both screenshot hotkeys (normal and quick) only work while this switch is on.
- Switch on Auto-attach to the open trade. Why: A screenshot is then attached automatically to the trade that is currently open. According to the text in the terminal, this setting is only used by the picker inside the terminal window, which is the case when Quiet screenshot popup is switched off. In the screenshot editor and in the small popup, you choose the target yourself.
- Under Screenshot capture, choose how the capture works: Drag an area or Whole screen. In the video, Drag an area is chosen because the trader draws his areas one by one.
- Leave the Screenshot editor switched on if you want to draw or write on your screenshots, similar to Lightshot or Epic Pen. If you do not need this, switch it off.
- For Auto-save after, you can leave 10 seconds.
- Scroll to Auto-screenshot target and choose Monitor(s) instead of Window(s). Click Choose monitor(s)… and enable the monitor you trade on.
Why: According to the video, window mode may work with ATAS Classic, but it does not work in ATAS X, NinjaTrader and Sierra Chart, so use the monitor there. The text in the terminal says: "Window mode fits Sierra Chart and ATAS. For NinjaTrader use monitor mode — its charts are drawn on the GPU and stay black in a window capture." A second hint says that some platforms give every chart the same window name, so the charts cannot be told apart. This is the case in ATAS X, where all charts sit as tabs in one window called "ATAS X". Where the video and the terminal text differ, monitor mode is the safe choice. If a screenshot does not show your chart, switch to monitor mode.
- Open Hotkeys and check the keyboard shortcuts. For the normal screenshot (Screenshot (drag an area)), Ctrl + Shift + S is set in the video. Next to it there is Quick screenshot (save right away), set to Ctrl + Alt + S by default. It saves the whole screen right away without the editor: to the open trade, or to During Trade when no trade is open.
Voice notes and dictation (3:04)
Instead of typing during a trade, you can speak. The terminal writes it down.
- Open Settings, then Voice Notes.
- Switch on Voice notes (local speech-to-text). According to the video, this is off by default.
- For the spoken language, you can leave Auto-detect.
- Under Microphone, select your microphone and click Test microphone. The terminal says "Say something — the bar should move." Speak. The bar has to move, and the result then reads "Signal OK". If it reads "No signal — check the microphone or choose another one", pick another microphone. Why: Sometimes Windows uses a different microphone. Then the terminal reports during dictation that no microphone is connected. The test makes sure that the right microphone delivers a signal.
- Under Dictation target, choose where the dictation should go: Ask me each time, Trade note or A journal section. In the video it is Ask me each time.
- At the bottom you see the line Speech model: Parakeet (PFT choice). In the video it is Parakeet. If the model is not ready yet, the terminal uses Whisper until it is.
Trade recording (4:18)
Trade recording records videos automatically. Before the entry and after the exit, an adjustable amount of time is kept.
- Open Settings, then Trade Recording.
- Set the video recording to Record video.
- Choose the Quality. The more storage your PC has, the higher you can go. The terminal shows you the storage needed: Standard · 1080p is about 2.7 GB per hour. In the video, Economy · 720p is chosen.
- Under Cutting, choose when the clips are cut:
- During trading (right after each trade)
- After the session (on button)
- Automatically when the session ends In the video, During trading is chosen.
- Under Screens, you decide which screens are recorded. In the video, Screen 1 is active, the screen the trader trades on.
- Lead-in (seconds) and Lead-out (seconds) determine how many seconds of video you want to see before the entry and after the exit. In the video, 5 seconds is usually enough. A bigger number shows you more of what happened before the trade.
- You can leave Storage limit (GB) and Keep videos for (days) at their default values.
- Switch Sound and Popup on or off as you like.
- Under Save location, you see where the videos are stored. With Change…, you choose a different folder, for example a Google Drive folder. With Open folder, you open the folder.
- Under Video encoder, you can repeat the detection with Check again if there are problems.
Live Desk and screenshots in practice (6:42)
The demo in the video runs in ATAS with Market Replay. In real use, it is the live market.
- In the EdgeBook, click Live Desk. The Live Desk opens as a window over your chart.
- Press your screenshot hotkey (Ctrl + Shift + S) and drag the area.
- In the screenshot editor, you mark for example resistance and support areas and add text if needed. The tools are in the bar at the edge, and a right-click gives you the same functions.
- Under Send to, choose the target, for example Pre-Trading Plan. Alternatively, copy the screenshot to the clipboard, for example to send it in Discord.
- Click Save. If you chose the clipboard under Send to, this button reads Copy. Next to it there is Discard: It only drops your drawings and keeps the original screenshot (Esc does the same).
Pre-trading plan and journal sections (8:26)
The Live Desk has several sections. In the video you see Pre-Trading Plan, During Trade and a section for the analysis after the trade that the trader created himself ("After Trading Analysis").
- Write your plan for the day in the Pre-Trading Plan section. You can also dictate.
- In the During Trade section, you record thoughts during the trade. In the section for the analysis after the trade, you record your evaluation.
Why: This way you sort your thoughts in advance and find them more easily later. You write in an editor with text formatting.
Start a session and record trades (8:56)
- Click Start session.
- In the video, a notice appears that screen recording is in progress.
- Take your trades as usual. The recording keeps running. Later, only the entries and exits with the time in between are cut out of the full recording.
Journal during a running trade (9:36)
- Open the open trade in the Live Desk.
- Write or dictate your thoughts in the Trade note.
- Choose the Setup and the Tags.
- If rules are saved for your setup, tick them off under Your rules. This records how closely you followed the rules.
- The recording keeps running in the meantime. The day result (in the video: Day net) updates with every trade.
- At the end of the trading day, stop the recording. In the video, a notice then appears that the videos are being cut.
Review in the Trade Tab (10:47)
- Switch back to the normal terminal and open the Trade Tab.
- Because the demo ran with Market Replay, switch to Replay. Choose the month and the day.
- You see the evaluation for your setup, here Delta Divergence, the number of trades of this setup on that day, whether your bias was correct and whether you followed the higher time frame rule.
Trade videos (11:20)
- Scroll down in the Trade Tab to your trades. Trades with a video are listed there, with profit or loss.
- Open the video of a trade. When you move the mouse over the timeline, you see the mark for the entry.
- You can zoom into the video and increase the Speed. Jump to the point where you exited.
Why: This way you see your trade with your notes, your stats and the video in one place.
Video: Part 6, length 12:05
Part 7: Risk Guard and the Prop Firm module
What you learn: You set up the Risk Guard, which slows you down at loss or trade limits, and you create a prop firm account with rules, transactions and evaluation. At the end, you use the Monte Carlo function to simulate how an account could run with your numbers.
The videos and screenshots show the English interface. Names of buttons and menu items are written in bold, exactly as they appear on screen.
Why a Risk Guard (0:00)
Some traders start to tilt as soon as a threshold is reached or the market does not do what they expected. The Risk Guard then steps in, so that you calm down and get out of the state of fear.
Risk Guard settings (0:48)
Open MENU, then Settings, then Risk Guard.
- Switch on the Tilt-Guard. According to the text in the terminal, this is a full-screen STOP overlay as soon as today's net loss exceeds the limit. It resets daily.
- Under Max daily loss ($), enter your limit. In the video it is 500 dollars.
- With Trigger every time (not just once a day), decide whether the warning should appear only once a day or again. It applies to both rules, the stop window and the trade limit. When it is switched on, the stop window appears again after a new trade as soon as your loss is deeper than when it was last shown, and the trade-limit reminder appears again with every further trade.
- Switch on Max trades per day if you want to use this limit. Otherwise switch it off. Under Trade limit / day, enter the number. In the video it is 6 trades. According to the text in the terminal, this limit shows a reminder in the bottom right corner once you reach it. The reminder ("Enough for today") disappears on its own after about 22 seconds. No stop window opens and nothing is locked. Each trade of the day counts, win or loss.
- Under Max loss streak, you enter how many losing trades in a row are your limit. In the video it is 3. Any win resets the count to 0. This value and the daily profit target below are only used for the progress display in the Risk Manager widget. They do not open the stop window and do not show a reminder.
- Under Daily profit target ($), enter your target for the day. In the video it is 500 dollars.
- The Prop-firm early warning is switched on by default. It brings the terminal to the front with a warning when a linked prop account gets close to its drawdown floor or its daily-loss limit. For this there is Warn when buffer ≤ ($). The value 0 does not switch the warning off: Then the terminal uses the size of one average losing trade of that account, at least 150 dollars. In the video the value is 0. To switch the warning off, switch off Prop-firm early warning.
The stop window (2:08)
The window that the Risk Guard shows fills the terminal window. You cannot click it away until you have typed a sentence. Why: This should calm you down and bring you into a more rational state, instead of throwing everything away.
- In the Risk Guard settings, scroll to Make the stop page personal.
- Enter a Title and your own text under Your goal or motivation, for example with a quote. You can also add Images.
- Under Color, choose for example Calm blue, Night (dark neutral) or Deep sea. The default is Alert (red, default).
- Click Preview with my content to see the page. With Preview standard page, you see the default version. Nothing happens in the preview, and there is no real loss.
- To close it, type the displayed sentence into the field Type the sentence here and click I understand — close. Upper and lower case do not matter.
- After you have typed the sentence, the window disappears again. Hopefully you have avoided a bad day with it.
The Prop Firm module and the rAI prop firm guide (3:43)
- Open the Prop Firm tab and maximize it.
- If you still need a prop firm, use Find your next prop firm with rAI. rAI asks you seven short questions and recommends the firm that fits your trading style. You click through the answers.
- If you click one of the recommendations, a window about the firm opens.
Add a prop firm account (4:23)
If you already have a prop firm, you create the account in the tracker.
- Click Add Account. New prop account opens.
- Under Firm preset, choose your firm from the templates. If it is not there, choose Custom. With a custom firm, you cannot choose a plan.
- Enter a Display name. In the video it is "Test 1".
- Link the Trading account (trades). As soon as your first trade has come into the journal through the terminal, your trading account shows up in this selection. Then you link it.
- Set Phase, Status, Starting balance and Since. In the video: Evaluation, Active, 50000.
- Under Drawdown model, choose the Trail basis, for example Trailing — End of Day, and enter the Drawdown amount $.
- Under Rules, enter your values: Profit target $, Daily loss $, Consistency %, Target days/month and Min trading days.
Why the target days: Many people underestimate how much they would have to earn per day on average. The terminal breaks your profit target down to that.
- Click Create. The account appears in your list.
Transactions and payouts (5:43)
- On the account, click Add transaction.
- Enter an expense, for example an evaluation fee (Eval fee). In the video it is 180 dollars. Click Add.
- When you receive a payout, you also add a transaction, this time as a Payout. In the video it is 1,000 dollars.
- At the top you now see what you have earned. In the example, the net P&L of this firm is 820 dollars.
Why: You see how high the return on investment is for this prop account. The terminal also warns you when one of the thresholds you set earlier is reached for the day.
Finance breakdown (6:15)
- Look at the passing rates. In the tab you find the Passing insights.
- Filter the Finance breakdown By firm, By account type, By account size or by Expenses.
- Below that, you find more figures for your prop journey.
Monte Carlo simulation (6:48)
With Simulate on the account, you start a Monte Carlo calculation against the rules of this account. This is a simulation, not a forecast.
- On the account, click Simulate.
- Under Data, choose the basis: Strategy / setup, All trades or My own numbers. You need your own numbers if you know them. If not, collect them first with backtesting in the terminal.
- With your own numbers, enter Win rate %, Avg win $, Avg loss $ and Trades per day. With Fill from my trades, you take over values from your trades. In the video: 40 percent win rate, 300 dollars average win, 120 dollars average loss and 3 trades per day.
- Under Start from, choose Today's status and enter 60 under Days to simulate.
- Click Run simulation.
- You see whether the account survives the days (Survives 60 days), whether it is breached (Account breached) and the Median balance. The chart shows a light band for 5 to 95 percent of the runs and a darker one for 25 to 75 percent. In the video there are 2000 runs. With these numbers, no account was breached, and 100 percent survived the 60 days.
Why: This is a good visualization of how an account could perform with your numbers.
The next video is about the Charting, News and Community modules.
Video: Part 7, length 7:47
Part 8: Charting, News and Community
What you learn: You add more modules, use the Charting module with Openmarket and TradingView, set up the news calendar with an alert, and connect Discord inside the terminal.
The videos and screenshots show the English interface. Names of buttons and menu items are written in bold, exactly as they appear on screen.
Add a module (0:00)
There are two ways:
- Click the + next to the tabs.
- Or right-click a module tab and choose Add module. A list of modules opens next to the menu.
You can then choose between EdgeBook, Prop Firm, Charting, News and Community. The Mentoring module is also in the list. According to the video, it is coming later.
Charting: Openmarket and TradingView (0:23)
Choose Charting. In the module there are two chart sources: Openmarket (an open-source charting program) and TradingView. You can sign in to both.
- Click TradingView if you need your chart there. You switch between the two sources with the switch at the top right of the module's header bar, next to the icons for detaching and maximizing.
- You can create several charts. Right-click the module and choose Clone module to create a copy.
- With Detach to new window, you take the window out and can move it to another monitor, for example. With Dock back, you bring it back into the terminal.
- This is how you put together your trading workspace the way you like it.
Please note: Openmarket allows only one active session. With several Openmarket charts, Openmarket shows a notice in the video that the session moved to another device, with a Reconnect here button. In the video, this is presented as not a big problem.
What the Charting module is for: In it you can look at the Dow Jones, the Russell, ES and individual stocks, for example, to better understand the market environment of the day.
News module and economic calendar (1:49)
Choose Add module, then News. According to the video, the module is still being expanded and currently offers only the basic functions.
- The data comes from Forex Factory. At the top, choose This week or Today.
- Filter by Countries, for example only the USA, and by importance, for example three or two stars.
- You see when which news is released, with the expected time.
Set up the news alert (2:27)
Why: Shortly before an important news release, a small window appears in the bottom right corner of your monitor. You then know that it is a good moment to get out of a trade or not to take one.
- Open MENU, then Settings, then News.
- Switch on News alert popup.
- Under Warn ahead (minutes), set how many minutes beforehand you want to be warned. In the video it is 5 minutes, for example before the CPI at 2:30 PM.
- Under Minimum importance, choose ★★★ High only, ★★ Medium and up or ★ All.
- Under Alert sound and Alert volume, set the sound and the volume.
- Under How long it stays (seconds), you decide how long the window in the bottom right stays on screen.
- Under Show on display, you choose the monitor.
Community widget with Discord (3:23)
The Community module shows Discord inside the terminal. This is handy if you do not join calls but still want to be present in Discord chat rooms while you are in a trade. For example, you have the terminal on the left of the monitor, your charting software in the middle, and you want to know what is going on in the community.
- Choose Add module, then Community.
- Discord shows a dialog asking whether you want to open the Discord app. There are Open App and Continue in Browser.
- Click Continue in Browser.
- Sign in to Discord. After that, you are signed in to Discord in this area of the terminal.
The next video is about rAI and how you use rAI and your own AI (ChatGPT and Claude).
Video: Part 8, length 4:16
Part 9: rAI and MCP (connect ChatGPT and Claude)
What you learn: You use rAI, the AI in the terminal, for reviews, agents and questions about your trades. You also connect your own AI, ChatGPT or Claude, to your journal through MCP.
The videos and screenshots show the English interface. Names of buttons and menu items are written in bold, exactly as they appear on screen.
Introduction (0:00)
The first part of becoming a better trader is collecting your trades and backtests. The second part is analysis and looking for patterns. The built-in AI is there for that.
Why rAI (0:24)
Collecting data is the first step, building something on top of it is the second. rAI can read your tags, setups, strategies and everything you wrote or dictated. rAI builds its picture of you from your written thoughts and your trade thesis.
rAI chat, reviews and agents (1:03)
- In the toolbar, click Ask rAI. On the left you see the areas Chat, Reviews, Agents and Memory.
- Under Reviews, you find the activity of your agents, for example the weekly reviews.
- Under Agents, you create your own agents. Click Add agent and choose for example the Weekly report. There you set when you want to receive the report and for which time frame, for example this week or a monthly report.
- Open a review. In the example in the video, you read there what went well and what went badly during the week. The review has sections such as Key finding, What went well, What went wrong, Rule check and Takeaway. The rule check shows rule breaks that rAI detects from your journal.
Memory and trader profile (1:58)
The memory is important because rAI learns and grows with you. The more data you provide, the more precise the answers about what helps you most in your current phase.
- Open Memory.
- Under About you, it says who you are, what your trading DNA is, which weaknesses and strengths you have and what you prefer.
- Click Complete with rAI to fill this in or to revise it later. rAI asks you five questions. You can type or dictate the answers.
- After that, rAI has an overview of what type of trader you are.
- With the field Tell rAI something to remember…, you can give rAI additional information.
Ask rAI about your trades (3:18)
- Go to Chat.
- Ask a question about a single trade, a day, a week or a month. In the video: "How did I do in August and what mistakes do I have to avoid?"
- rAI answers with your real numbers and recognizes patterns. In the example, rAI shows that the losses cluster on one signature: The notes themselves say that the entry was too early and the absorption was not confirmed.
- rAI answers in the language you set in the settings. If you set the language to German, rAI answers in German. You find the setting under Settings, Appearance, Language.
Connect ChatGPT through MCP (4:11)
If you do not want to use our AI, you can connect your own AI. Instead of ChatGPT, you can also connect Claude, or your local AI if you work in a development environment (IDE).
- Open MENU, then Marketplace. There you find Connect your own AI through an MCP connection. This is part of the Trader + AI plan. The buttons for Claude, ChatGPT and Copy web URL only appear once cloud sync is switched on (the terminal asks for your consent once). Connect locally is for AI programs on your own computer.
- Choose ChatGPT. ChatGPT opens.
- In ChatGPT, go to Plugins. There you look for the PFT EdgeBook plugin. If it is not installed yet, choose Install. Then connect it with Connect.
- Enter your email address and your password. These are the same credentials you use to sign in to the Pro Futures Trading dashboard.
- ChatGPT asks whether it may read your data. Click Approve.
- You land back in the plugin area and you are connected.
- In the chat, write for example: "Find my biggest trading leak this month". ChatGPT then has access to all your trades that are stored in our cloud, and gives you an overview of what went well and where you can improve.
Connect Claude through MCP (6:05)
With Claude, you proceed in a similar way.
- In Claude, open the customization for connectors (in the video: Customize).
- When you add it, Claude shows a notice that the connector was suggested through an external link. This is expected here: It is the PFT EdgeBook MCP connector.
- Connect the connector. If you are not signed in, you first have to sign in and connect again.
- After that, you ask Claude something about your journal.
In the Marketplace, you see the options for this at a glance: Connect locally, Claude, ChatGPT and Copy web URL. The status shows whether the connection is active.
The next and last video is about the settings. If you have questions, write them in the comments.
Video: Part 9, length 7:07
Part 10: Settings and help
What you learn: You get to know the settings of the terminal: appearance, accounts, commissions, instruments, trades, import, cloud sync and privacy. You also know where to find support and Help AI.
This video is mainly for looking things up. It is worth watching when you have questions or want to go deeper. The videos and screenshots show the English interface. Names of buttons and menu items are written in bold, exactly as they appear on screen.
Introduction (0:00)
This is the tenth and last video of the masterclass. You can adjust the settings in many places. You do not have to change most of them.
Open the settings and Appearance (0:18)
- Open MENU, then Settings.
- On the left you see two areas: General and EdgeBook.
- Open Appearance. There you set the Language, for example German or English. According to the video, the translations are still in the beta phase, but they are meant to be translated properly.
Scale and Live Desk size (0:39)
- UI scale (%) applies to the whole terminal. If you have a large screen and good eyes, you can set the value to 90, for example, and the interface gets smaller. If you need larger text, increase the value. You can enter 50 to 200, the default is 100.
- Live Desk size (%) changes only the Live Desk window. You see the size right away when you change the number. You can enter 60 to 120, the default is 100.
- Under Theme, you choose Dark or Light.
Performance (1:32)
Under Performance, you choose the performance mode Standard or Fast. If you have a good PC, Fast is right in most cases. If it lags, use Standard.
Voice notes, screenshots and hotkeys (1:43)
The Voice Notes and Screenshots sections are explained in Part 6. There you set up speech recognition and everything about screenshots.
The Hotkeys are important. Here you set the keyboard shortcuts for the normal screenshot, the quick screenshot, dictation and the rAI window. With Ctrl + Shift + R, for example, you open the small rAI window, in which you can also chat.
Diagnostics and Display (2:28)
- You only need Diagnostics when errors occur in the software. There you can send the log. With Export log, you create the file, and with Open log folder, you open the folder. Most of the time you do not need this.
- In the Display section, you find the Widget content size. If you make it larger, your content and your text get larger. It scales the content inside the tiles (70 to 200 percent), the size of the tiles stays the same.
Strategies, Risk Guard, News and Setups (3:19)
- You already know Strategies from earlier videos. They give you a different overview of the dashboard.
- Risk Guard is explained in Part 7.
- Under News, you set up the window in the bottom right that appears before news (Part 8).
- Under Setups and Tags, you manage your trade setups and tags.
Accounts (3:39)
- Open Accounts. Normally all your accounts are detected automatically. If not, you add an account by hand with Add account.
- If a trade is in the wrong account, you can move it. To do this, open the account and choose Move to … on the trade. In the video, a trade is moved from the replay account to the demo account.
- You can hide an account (Hide from account filters (stays here, numbers unchanged)). It then no longer appears in the account filters. If you show it again (Show in account filters again), it is back.
Why: With several prop accounts, you may want to keep the data for analysis. Hiding keeps the filter list short, and your data stays in the terminal.
Commissions and break-even range (4:46)
- Under Commissions, the fees are normally captured automatically. With ATAS X, no commissions are currently sent along. Then you enter them by hand or change them. You can set them Global or Per Account.
- Under Statistics, you set the Breakeven range ($). The value is in dollars and is applied to the net result of each single trade (after fees). A trade within plus or minus this amount counts as break-even: It is neither a win nor a loss and is not counted in the win rate. In the video, the example is that a trade within plus or minus 5 still counts as break-even. Net P&L, expectancy and profit factor stay unchanged. The default is 0, which means exactly 0 dollars. This is a small but important setting, especially for your win rate.
Instruments (5:37)
- Under Instruments, all instruments are normally captured automatically.
- If there is a problem, you create an instrument yourself: Add instrument with Tick size and Tick value ($).
- If you do not know how to calculate the values, look at an existing instrument. For MNQ, the video shows a tick size of 0.25 and a tick value of 0.5.
Trades tab (5:53)
- Under Trades, you see all trades you took in the terminal. The list can get very long.
- You can filter it, for example by From and To, or by account.
- You can assign a trade to a different account (Move to …). With the icons on the trade, you edit it.
Import trades (6:36)
Under Import Trades, you bring existing trades into the terminal, for example from NinjaTrader, from Sierra Chart, from a CSV file or from Rithmic. You know this from an earlier video.
- Choose the source or the Platform preset and the file.
- Filter the trades and choose which ones you want to add.
- You do not see duplicate trades, because the system detects them automatically and does not count them toward your trades.
The settings for Trade Recording are explained in Part 6.
Sync and privacy (7:20)
Open Cloud sync.
- With Pause cloud sync, you stop the synchronization, for example if you have a lot of data and do not want to upload it. Otherwise leave it off.
- Candle charts & P&L curve are not included by default. It is a lot of data. If you still want them in the cloud, you switch them on. The terminal then asks you to confirm and shows how much data will be uploaded. In most cases you leave it as it is.
- Screenshots are off by default. Some people do not want the AI to be able to read screenshots, because they may show private account numbers, for example. If you switch it on, the terminal asks whether you really want to upload the screenshots. With Cancel, everything stays as it is.
- Withdraw consent stops cloud sync for good and releases this device. The terminal asks you to confirm with a second click. Your cloud data stays as it is. If you switch cloud sync on again later, the terminal asks for your consent once more.
Notifications and delete account (8:35)
- Notifications: The video mentions this area only briefly. There you find the notices you have closed, and you can show them again with Show again.
- Under Data, you can delete your account with Delete my account. To confirm, you type DELETE ACCOUNT. The terminal then requests the deletion of your account and everything stored about it on our servers. You have 30 days to change your mind, and nothing is deleted before that. The database on your computer stays where it is. Hardly anyone needs this, it is just there.
Support, feedback and Help AI (8:58)
- For questions, write in the video comments or use Support & Feedback in the MENU.
- Help AI answers questions about the terminal (10 requests per account per day, 100 messages per month). It is part of the Trader + AI plan.
Video: Part 10, length 9:49