

Products
PFT TerminalJournal, live desk and AI mentor in one windowPFT Market SuiteBuilt on 8 years of market experiencePFT ForgeGamma levels and key strikes for ES and NQPFT Prop Scout17 futures prop firms, side by sidePFT CraftBuild custom indicators for your specific needsOur own prop firmComing soonAI and MCP accessYour journal, readable by an assistantLearn
Trading course8 years of mistakes and errors, aggregated for youResourcesArticles and trader linksFree calculatorsFutures, win rate, Monte Carlo, drawdown, consistencyDiscord community650+ futures tradersCompany
CareersApply to work with usPartner dealsDiscounts we passed onSupportGet an answer from a humanHow do I learn order flow trading in 2027?
To learn order flow trading, work through five steps in order: understand what the tape and the order book show, read a footprint chart, track delta and cumulative delta, learn to tell absorption from exhaustion, and place all of it on a volume profile. Then practise in replay and keep a journal. Free guides and platform tutorials cover every step; a course or a call with a mentor is optional and helps you find the blind spots in your own trading.
Disclosure: the guides we link first are our own. Nothing here guarantees that you will become profitable; futures trading involves significant risk of loss.
What order flow means
Order flow trading reads executed trades and resting orders instead of only price candles. In the vocabulary ATAS uses, delta is the net difference between market buys and sells, and cumulative delta (CVD) is delta accumulated since the start of the session.[1] Our own definition and a worked ES/NQ view are in the guide What Is Order Flow Trading?
How we built this path: we ordered the topics by dependency, so each step needs the one before it. We link free material first and list the source for each. We do not rank paid courses, and we only describe what the pages themselves say.
The path, step by step
Step 1: The tape and the order book
Learn what a market buy, a market sell and a resting limit order are, and why a trade prints on the bid or the ask. Start with What Is Order Flow Trading? A Guide for ES and NQ. ATAS also publishes a free guide, "Order Flow Trading: Complete Free Guide".[2]
Step 2: The footprint chart
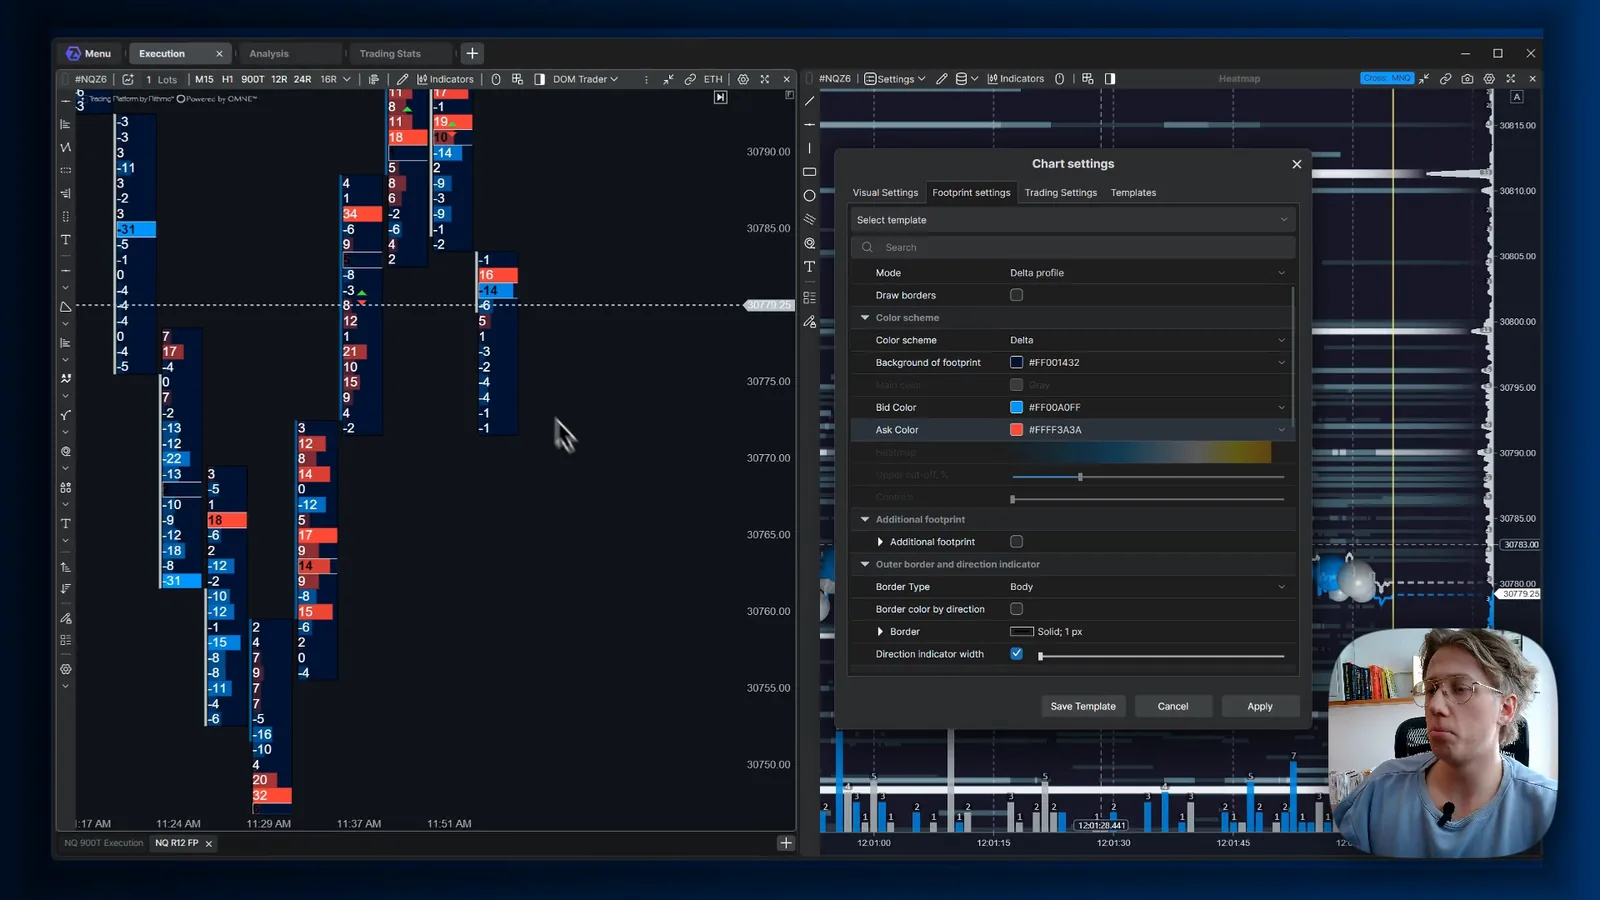
A footprint chart splits each candle's volume by price into bid and ask volume. Learn to read imbalances and stacked imbalances. Read Footprint Charts Explained: Bid/Ask and Imbalances. ATAS describes related tools such as Cluster Statistic, Cluster Search and Stacked Imbalance.[1]
Step 3: Delta and cumulative delta
Delta tells you who was more aggressive in a candle; CVD shows the running balance. Read Cumulative Volume Delta (CVD) Explained. When price and delta disagree, you have a divergence: Delta Divergence: Reading Absorption in Order Flow.
Step 4: Absorption versus exhaustion
Absorption means aggressive orders are met by passive liquidity and price does not progress. Exhaustion means the aggressive side runs out of fuel. The difference matters because they imply different trade ideas. Read Absorption vs. Exhaustion in Order Flow.
Step 5: Volume profile and context
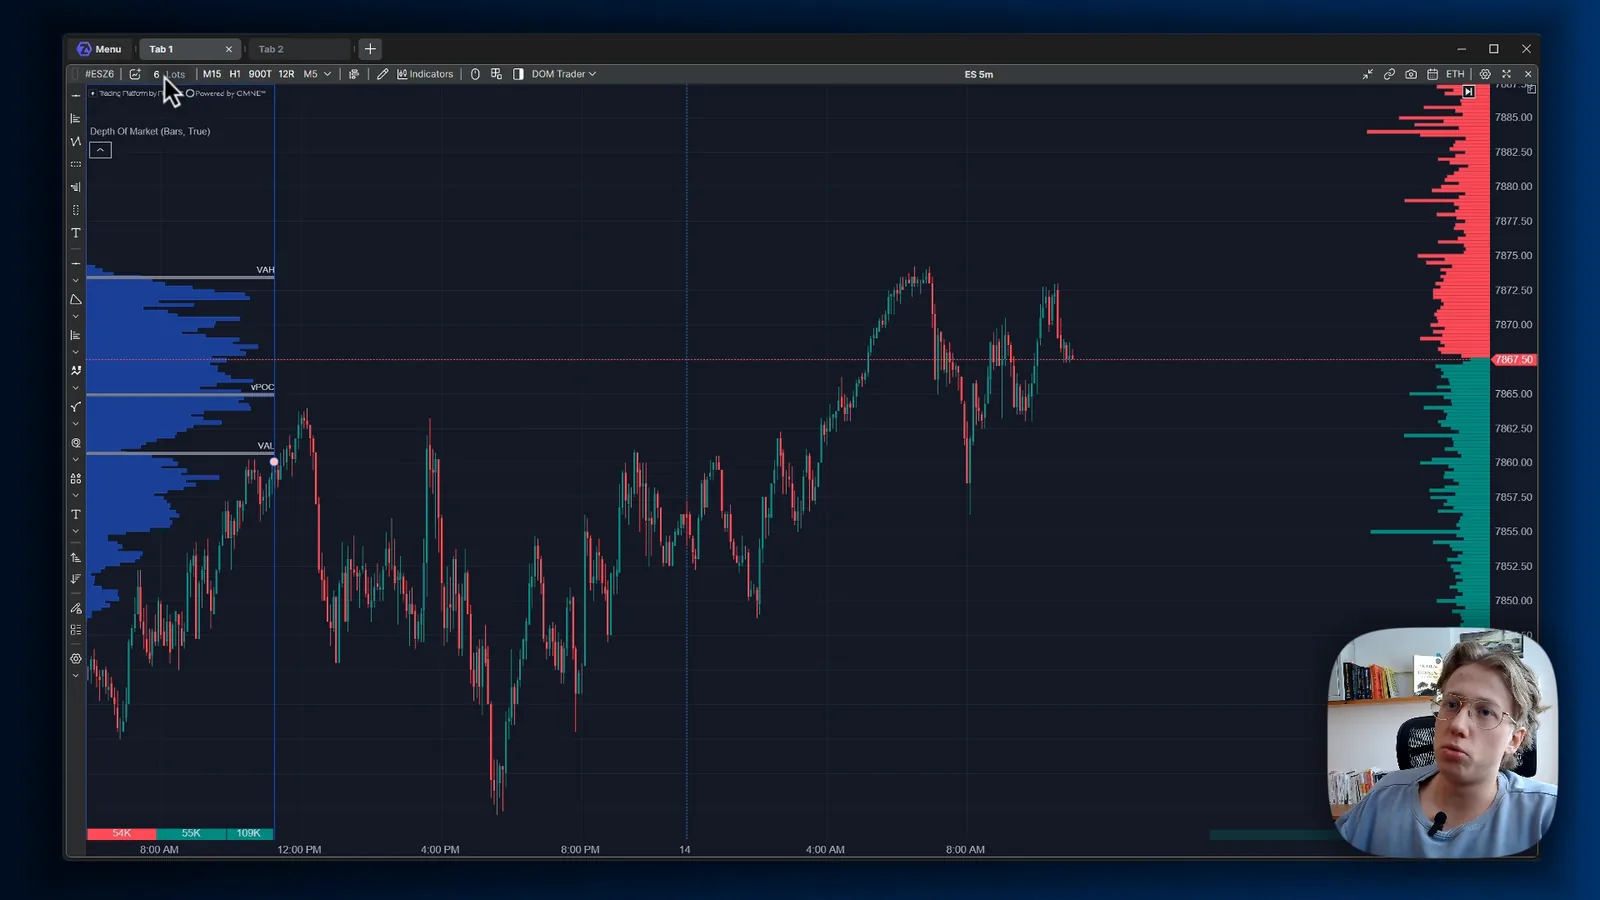
Volume profile shows where the market traded most, with the point of control (POC) and the value area. It turns single footprint signals into context: is this absorption happening at a level that matters? Read Volume Profile, POC and Value Area for Futures and, for a session reference, VWAP for Futures Day Trading.
Step 6: Set up your tools and practise
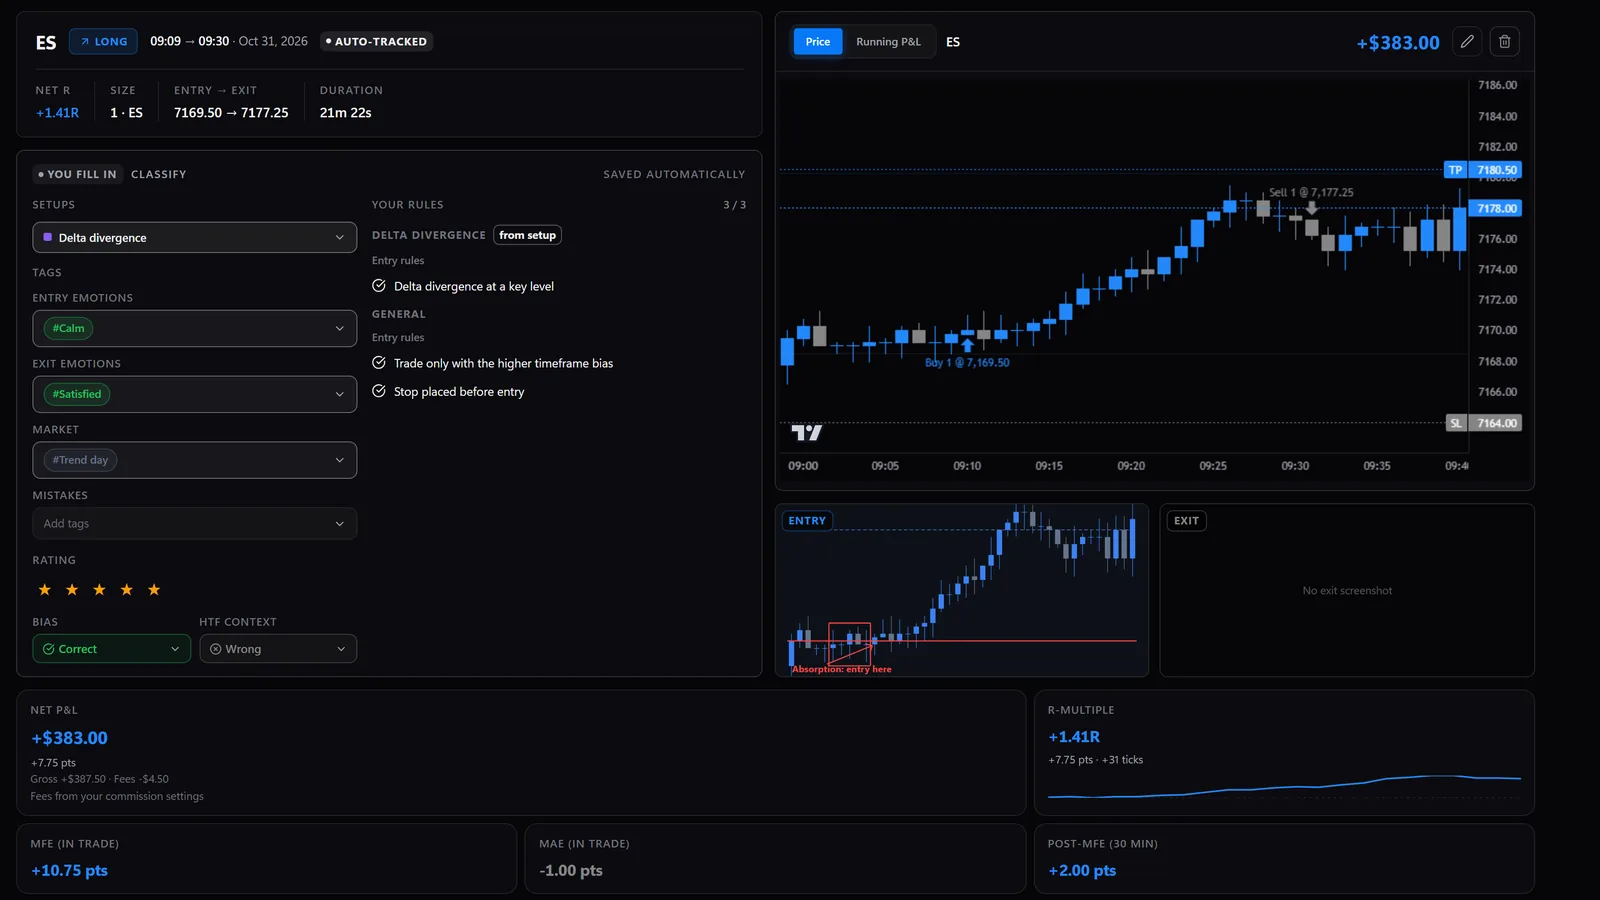
Set up your platform: How to Set Up Order Flow Tools in ATAS and What Is the Heatmap in ATAS? Practise in replay or on a demo account before risking money, and write down every trade; the guide Futures Trading Journal: What to Track and How to Review shows what to record.
Free resources outside PFT
| Resource | What it offers | Note |
|---|---|---|
| ATAS free guide | "Order Flow Trading: Complete Free Guide" on the ATAS blog[2] | Free |
| ATAS indicator overview | Descriptions of footprint-related tools (Cluster Search, Big Trades, CVD, Volume Profile & TPO)[1] | Free |
| Bikotrading Academy masterclass | Free masterclass on an order flow strategy, offered on the ATAS Marketplace[3] | Offered by a vendor that also sells paid coaching |
| CME Group: market by order | Exchange education page on MBO data[4] | Free |
These are the sources we found and read on November 2, 2026; there are others. We make no ranking among them.
Common mistakes when learning
- Skipping straight to indicators. Tools show data; you still need the concepts from steps 1 to 4.
- Reading single signals without context. Divergence at a random price is weak; the same divergence at a profile level is a different question (step 5).
- No record. Without a journal you cannot tell which signals you actually trade well.
- Treating any pattern as a promise. Patterns describe what has happened, not what will happen.
Where PFT fits
The PFT blog is free and covers the path above in ten linked guides. PFT-EdgeBook, our journal, is free and imports trades from ATAS, NinjaTrader and Sierra Chart; some add-ons are paid.[5]
If you would like feedback on your own process, PFT offers a free 15-minute call with the founder. The page says the call finds out where your process actually breaks, without sales pressure, and states: "Nobody here can tell you that you will make it." Our trading course is available after this free call, if it fits.[6]
Your questions answered
Still stuck? Write to support@profuturestrading.de and a real person replies.
Learn in order: tape and order book basics, footprint charts, delta and cumulative delta, absorption versus exhaustion, then volume profile. Free guides cover each step, including ten on the PFT blog, and ATAS publishes a free guide. PFT is our own site.
We could not find a reliable published figure and will not invent one. Reading the concepts takes days; recognising them live and managing risk takes practice in replay and a journal of your own trades.
No. The core concepts are covered by free guides and platform tutorials. A course or a call can help you find blind spots in your own trading, but it is optional. The PFT course is available after a free 15-minute call.
You need a platform with footprint charts and tape data. ATAS lists Footprint/Cluster charts, Cluster Search and the Heatmap (beta) in its free Start plan, with futures data delayed by 15 minutes; real-time futures data starts with Pro. Other platforms offer similar tools; check their own pages.
It can be a way to read the market, but no method guarantees profit, and futures trading involves significant risk of loss. Track your results in a journal before drawing conclusions.
A footprint chart shows bid and ask volume inside each candle by price. A volume profile shows where volume traded over a longer period, such as a session, with POC and value area. Use the footprint for what happens at a level and the profile for which levels matter.
Sources
All sources accessed on .
- 1.ATAS indicator overview (Delta and CVD definitions, footprint tools): atas.net/trading-indicators/
- 2.ATAS, Order Flow Trading: Complete Free Guide: atas.net/blog/order-flow-in-trading-free-training-by-atas/
- 3.Bikotrading free masterclass (ATAS Marketplace): marketplace.atas.net/product/step-by-step-order-flow-strategy---free-trading-masterclass
- 4.CME Group, market by order: www.cmegroup.com/education/market-by-order-mbo.html
- 5.PFT-EdgeBook: profuturestrading.de/terminal/
- 6.PFT free 15-minute call: profuturestrading.de/course/
- 7.ATAS plans and prices (free Start plan, data delay): atas.net/pricing/
Want feedback on your own trading?
Book a free 15-minute call. We look at where your process breaks; if it fits, our course is the next step.