

What is gamma exposure (GEX) and how does it move ES and NQ futures?
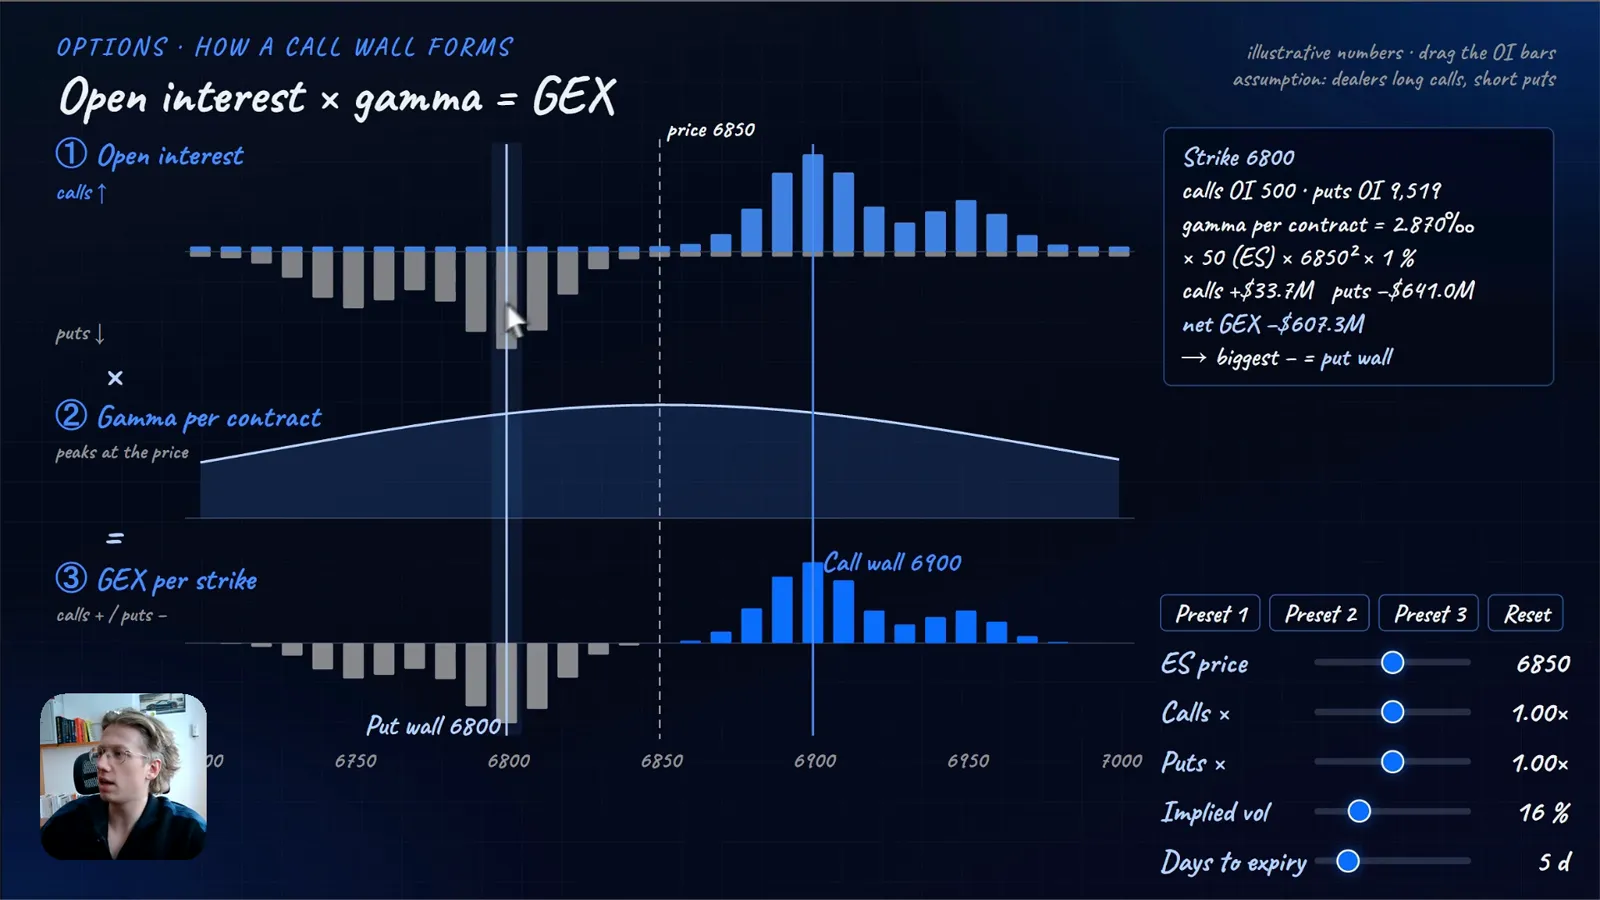
GEX, or gamma exposure, is an estimate of how many futures options dealers have to buy or sell to stay delta neutral as price moves, summed over all strikes and expirations. Dealers usually take the other side of customer options trades and do not want to bet on direction, so they hedge their delta in the most liquid market, the ES future. As price, volatility and time change, that delta changes, and dealers buy or sell futures again and again to stay neutral. In positive gamma that hedging tends to dampen moves; in negative gamma it tends to amplify them.
This is the written version of my full course on options flow for futures traders. The first half explains why options move futures, from the Greeks to GEX, walls, vanna and charm. The second half walks through every options indicator in ATAS X and how I use them on ES and NQ. Read it, jump to the minute you need, or watch along.
One thing up front, as in the video: options data is a map of where hedging pressure can build and a way to read the regime of the day. It is not a crystal ball, not an entry signal, and no guarantee that a level holds.
Why do futures traders watch options at all?
Because dealers have to hedge the options they hold, and they hedge in futures.
When a retail trader buys an option, someone has to sell it, and that counterpart is often a dealer or market maker. The dealer wants to earn the spread between bid and ask, not bet on direction. So he offsets the delta of the option in his most liquid market, the ES future. When price moves, the delta of the option changes, and he has to hedge again. That buying and selling of ES to stay delta neutral is the hedging flow, and it shows up in the order flow you already read on your chart. The bigger the position at a strike, the bigger the hedge orders near it.
Why ES and not something else? Dealers can hedge with many instruments, but ES is the most liquid, and the price of a future does not decay with time or react to volatility the way an option does. It only moves with price, which makes it easier to hedge with and to calculate.
What can options data tell you, and where does it come from?
Options data gives you context: where hedging pressure can build, which regime is likely, and which levels matter today.
In ATAS there are two very different data sources behind the options indicators, and the difference matters for how much you can trust a level.
| Options Chain Suite | Options X-Ray | |
|---|---|---|
| Indicators | 4 (OI Profile, Key Levels, GEX Profile, Expected Move) | 12 |
| Data | CME options data through your own Rithmic or Interactive Brokers connection (also through a Rithmic prop firm account) | SPX options data from Cboe, analytics by OptionsDepth, delivered through the ATAS servers |
| What you get | Price, volume and open interest. Open interest is published once a day, from the prior day. ATAS calculates the Greeks. | Positioning split into retail, pros, firms, brokers and market makers, updated every minute |
| Who bought, who sold | Unknown. Positioning is an assumption. | Estimated from the trades themselves, a more precise picture |
| Markets | NQ, ES and other futures with options, for example gold and crude oil | SPX-based only: ES, MES, SPY, US 500 |
| Feed and plan | Needs a real-time feed | Needs the ATAS Ultra subscription, works even on a delayed feed |
The two data sources behind the options indicators in ATAS, as explained in the video.
The participant groups in the X-Ray are a model by the data provider, not exchange-reported data.
What is the one assumption behind GEX?
That traders and funds sell calls and buy puts, and dealers take the other side.
This is the assumption the whole classic gamma exposure analysis rests on, and it is crucial to understand that it is an assumption. The idea: funds and traders sell calls (covered calls) and buy puts as protection against downside risk. Dealers or market makers take the other side of most of those trades. That makes dealers mostly long calls, which means positive gamma above the price, and short puts, which means negative gamma below it.
Exchanges publish open interest, but not who holds which side. With the Options Chain data, the sign of the position is therefore assumed, not measured. The X-Ray estimates it from trades instead. Real positioning can differ from the model, so every GEX level inherits this simplification.
Which Greeks matter for dealer hedging?
Delta, and the three second-order Greeks that change it: gamma, vanna and charm.
The first-order Greeks (delta, theta, vega and rho) change the price of the option. The second-order Greeks change the delta. For hedging flow, that second group is what counts, because every change in delta is a change in the hedge.
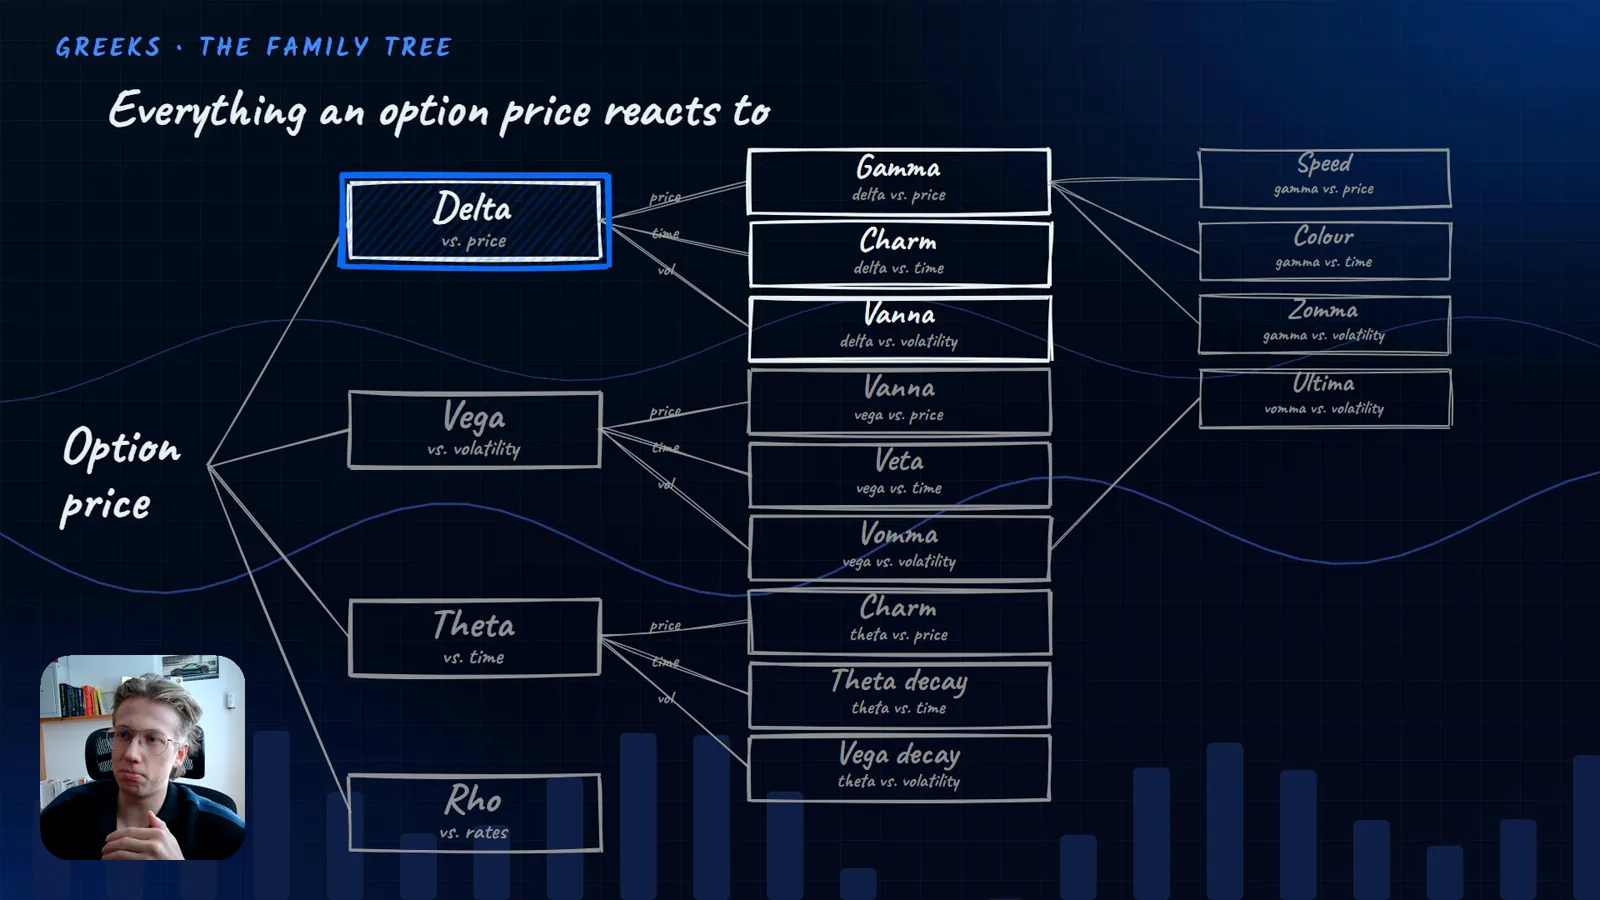
| Greek | What it measures | What changes it |
|---|---|---|
| Delta | How much the option price changes per one point in the underlying | Its own inputs, through the three Greeks below |
| Gamma | How much delta changes per one point in the underlying | Price movement |
| Vanna | How much delta changes per change in implied volatility | Volatility |
| Charm | How much delta changes per day passing | Time to expiration |
Delta and the three Greeks that change it.
An at-the-money option has a delta of about 0.5. Deep in the money it moves toward 1, deep out of the money toward 0. Dealers hold futures against that delta to stay neutral. Gamma, vanna and charm change the delta, so they change the hedge, and that change is the futures flow you can see.
What is the difference between positive and negative gamma?
In positive gamma, dealers sell rallies and buy dips, so moves get dampened. In negative gamma, dealers chase the move, so moves get amplified.
Net GEX sums gamma exposure over all strikes and expirations. That is the number behind a GEX heatmap or profile.
- Net GEX above zero, a long gamma environment: dealer hedging leans against the move. Moves tend to be dampened.
- Net GEX below zero, a short gamma environment: dealer hedging goes with the move, upward or downward. Moves tend to accelerate.
- Zero gamma flip: the price where net GEX crosses zero, the border between the two regimes.
In practice I read it like this: in a short gamma environment, breakouts have more room, because the hedging adds to the move. Range-bound traders prefer long gamma, where price is pushed back toward the middle. Both are tendencies, not rules.
What are call walls and put walls?
The strikes where the most open interest times gamma sits, so dealers have to trade the most futures around them.
The open interest profile shows where the most contracts are still open. Multiply that open interest by the gamma at the strike and you get the hedging needed to stay delta neutral. At the strikes with the largest values, dealers have to trade the most futures, and larger orders are likely there. A reaction is possible, not promised.
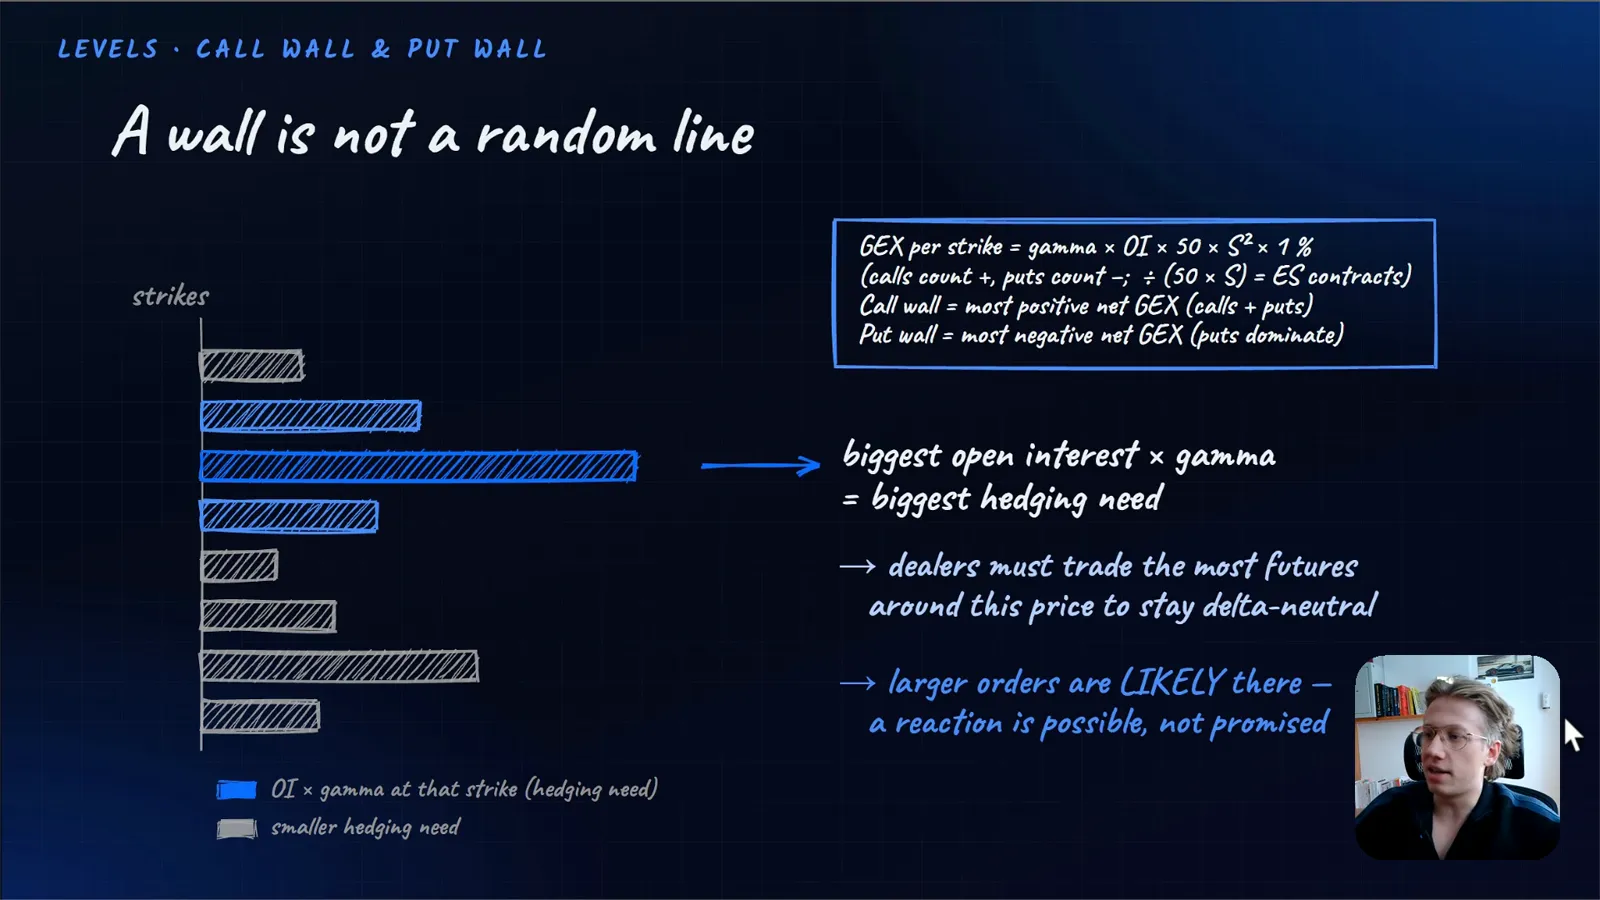
- Call wall: the strike with the most positive net GEX. Near a call wall, rallies tend to be sold. It often acts as resistance and sometimes like a magnet price likes to reach.
- Put wall: the strike with the most negative net GEX. On the way down into a put wall, dealers in negative gamma have to keep selling into the drop. At the wall itself, where dealers are short the most puts, they often buy, so you can expect reactions there. If a put wall breaks, expect erratic moves.
Do not read a wall as a strict border. It is an estimate of where you can anticipate price movement around that area, and it still needs confirmation from your own order flow.
How do you get from open interest to a wall? The worked example
GEX per strike = gamma x open interest x 50 x spot price squared x 1%.
| Step | Value in the example |
|---|---|
| Open interest at the 6,900 ES call | 20,000 contracts |
| Inputs for gamma (Black-Scholes) | ES at 6,850, implied volatility 16%, one day to expiry |
| Gamma per contract | 0.0048 delta per one point |
| Delta change per point (0.0048 x 20,000) | +96 ES |
| A 1% move (1% of 6,850) | 68.5 points |
| Hedge for a 1% move (96 x 68.5) | about 6,576 ES contracts |
| Nominal value of one ES (50 x 6,850) | $342,500 |
| Gamma exposure at this strike | about $2.25 billion |
One strike, step by step. Illustrative numbers from the course, not market data.
What happens behind the numbers: if ES rises one point from 6,850 to 6,851, each 6,900 call gains 0.0048 of delta. Across 20,000 calls, dealers who own those calls are now 96 ES too long. They do not want a directional position, so they sell 96 ES to be delta neutral again. That is positive gamma at work: dealers sell into the rise. Live tools recompute this every few seconds, because every change in price also changes gamma.
How do dealers hedge back to zero?
They trade against every change in delta until they are flat again.
If price falls and their delta turns positive, they sell futures and are back to zero. If price turns up and their delta turns negative, they buy futures and are back to zero. In a net negative gamma environment, a falling market means dealers keep selling into the drop until the large put wall, where reactions can be expected. When price starts rising again, they hedge back the other way.
What does the live lab show about GEX?
That GEX shifts with price, positioning and time, not only with open interest.
In the lab of the video, calls minus puts are netted at each strike. One strike had 500 calls and 9,519 puts open, which gave net call GEX of about 33.7 million and net put GEX of about minus 641 million, a net GEX of about minus 607 million. That strike was the largest put wall in the lab, simply because most puts were open there. Again, these are lab values, not market data.
- Price: the closer price moves to the put open interest, the more negative the environment gets. The closer it moves to the call open interest, the more positive it becomes.
- Positioning: making the calls bigger makes the put wall weaker.
- Days to expiry: the fewer days left, the steeper the gamma curve and the faster delta, and therefore the hedge, changes.
- Intraday positioning: open interest is a snapshot of the prior day. With intraday positioning, which only the X-Ray data provides, the picture changes as traders open and close positions. In the lab, the put wall moved from 6,800 down to 6,780 for exactly that reason. Open interest alone cannot show you that.
What are vanna and charm, and how do they move futures?
Vanna is the change in delta from implied volatility, charm is the change in delta from time. Both force dealers to re-hedge even when price does not move.
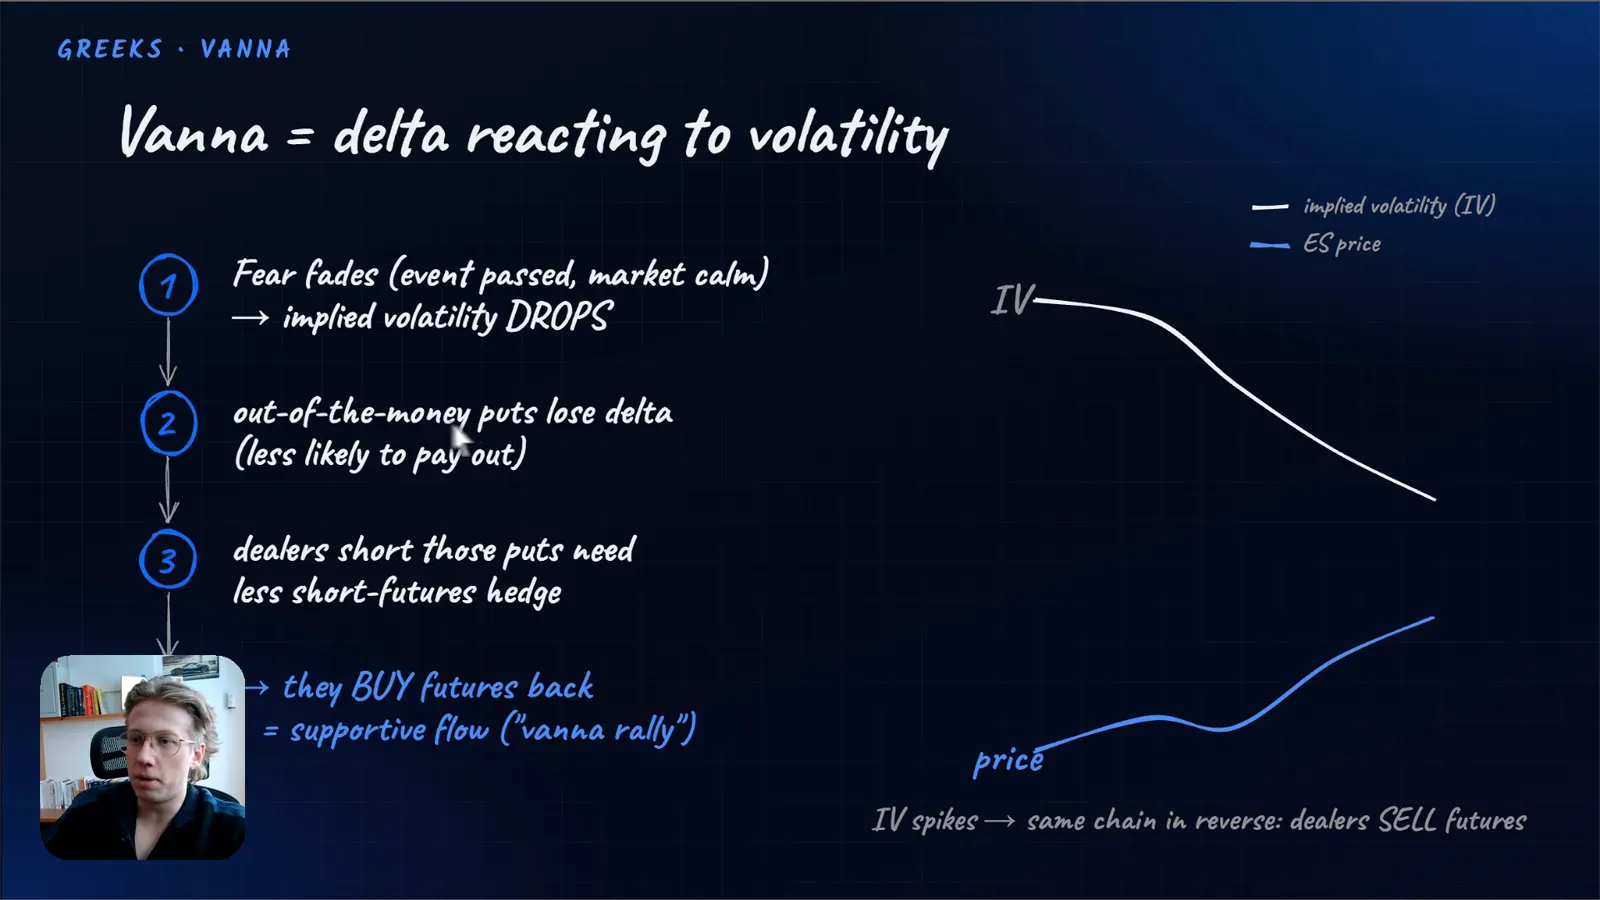
Vanna: when volatility drops
When a feared event passes, implied volatility drops. Out-of-the-money puts lose delta, because they are now less likely to pay out. Dealers who are short those puts need fewer short futures as a hedge, so they buy futures back. That is what is called a vanna rally: falling implied volatility pushes ES higher through hedging alone. Keep it apart from gamma. This flow is not caused by a price move, only by how delta reacts to volatility.
Charm: when time passes
As expiration gets closer, out-of-the-money options lose delta, because there is less time left for price to reach their strikes. The hedges against that delta unwind, and you can see a slow drift. The later in the session, the more the delta melts. This is strongest into the close and into OPEX, the options expiration.
| Vanna | Charm | |
|---|---|---|
| Reacts to | Implied volatility | Time |
| Typical trigger | Less fear in the market, implied volatility drops | The session moves toward expiration |
| Dealer reaction in the example | Buys back short futures hedges against short puts | Unwinds hedges as out-of-the-money delta melts |
Vanna and charm side by side.
So the dealer does not hedge only because of gamma, but also because of vanna and charm, and that shifts the GEX profile too.
Why 0DTE made charm matter more
With the massive rise in 0DTE options (options expiring the same day), charm hedging has become more significant, because the closer an option is to expiring, the more impact charm has on its delta. With 0DTE, that happens every day. Close to expiration, price also often likes to stay around the pin, the strike where it is pulled to, because larger moves become less likely as time runs out.
What does the hedge-flow simulation show?
The same dealer behaving differently depending on where price is.
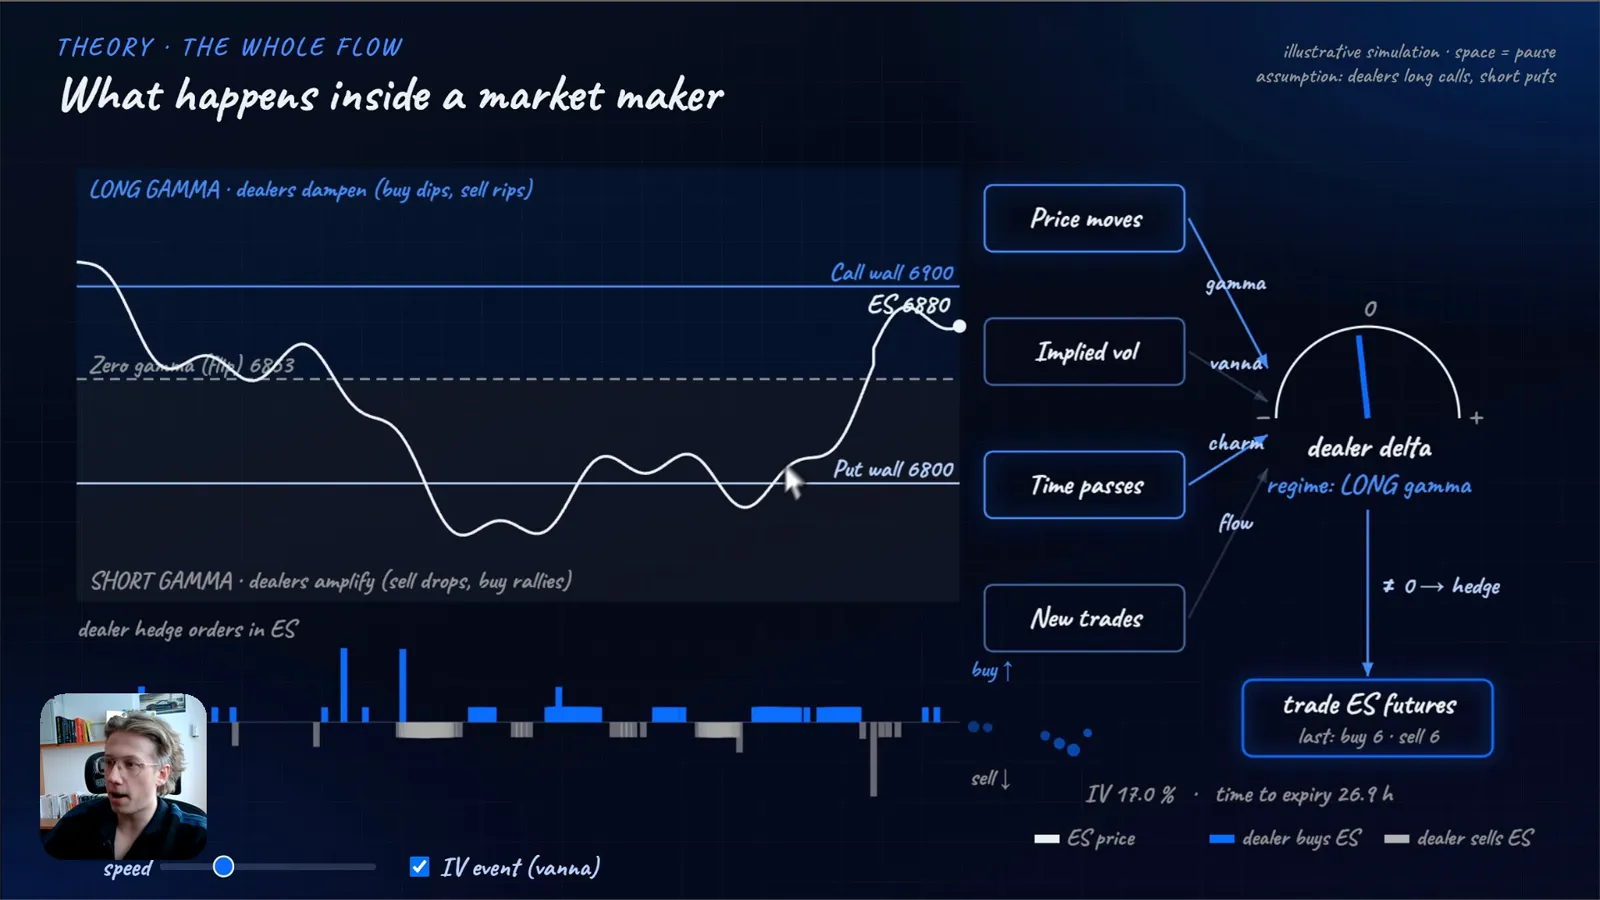
In the simulation, price first sits in the long gamma area near the call wall, the dampening environment: dealers sell the rips and buy the dips. As price moves toward the put wall into the amplifying environment, dealers sell into the moves or buy them back with the move. Speeding up time shows how charm adds more and more to the hedge as expiration approaches. The result of all three forces is the dealer hedge orders in ES, which you as a futures trader can see in the tape.
What can options not tell you?
Whether price will react, where to enter, or where your stop belongs.
Options tell you where pressure can build (levels from open interest), which regime is likely (from gamma, charm and vanna exposure), and therefore what kind of order flow pressure to expect, because dealers have to hedge. Without confirmation from your own order flow and market context, none of these tools is worth using on its own. They come on top of your existing order flow analysis, not instead of it.
Which options indicators does ATAS X have?
Sixteen, under options analytics: four in the Options Chain Suite and twelve in the Options X-Ray.
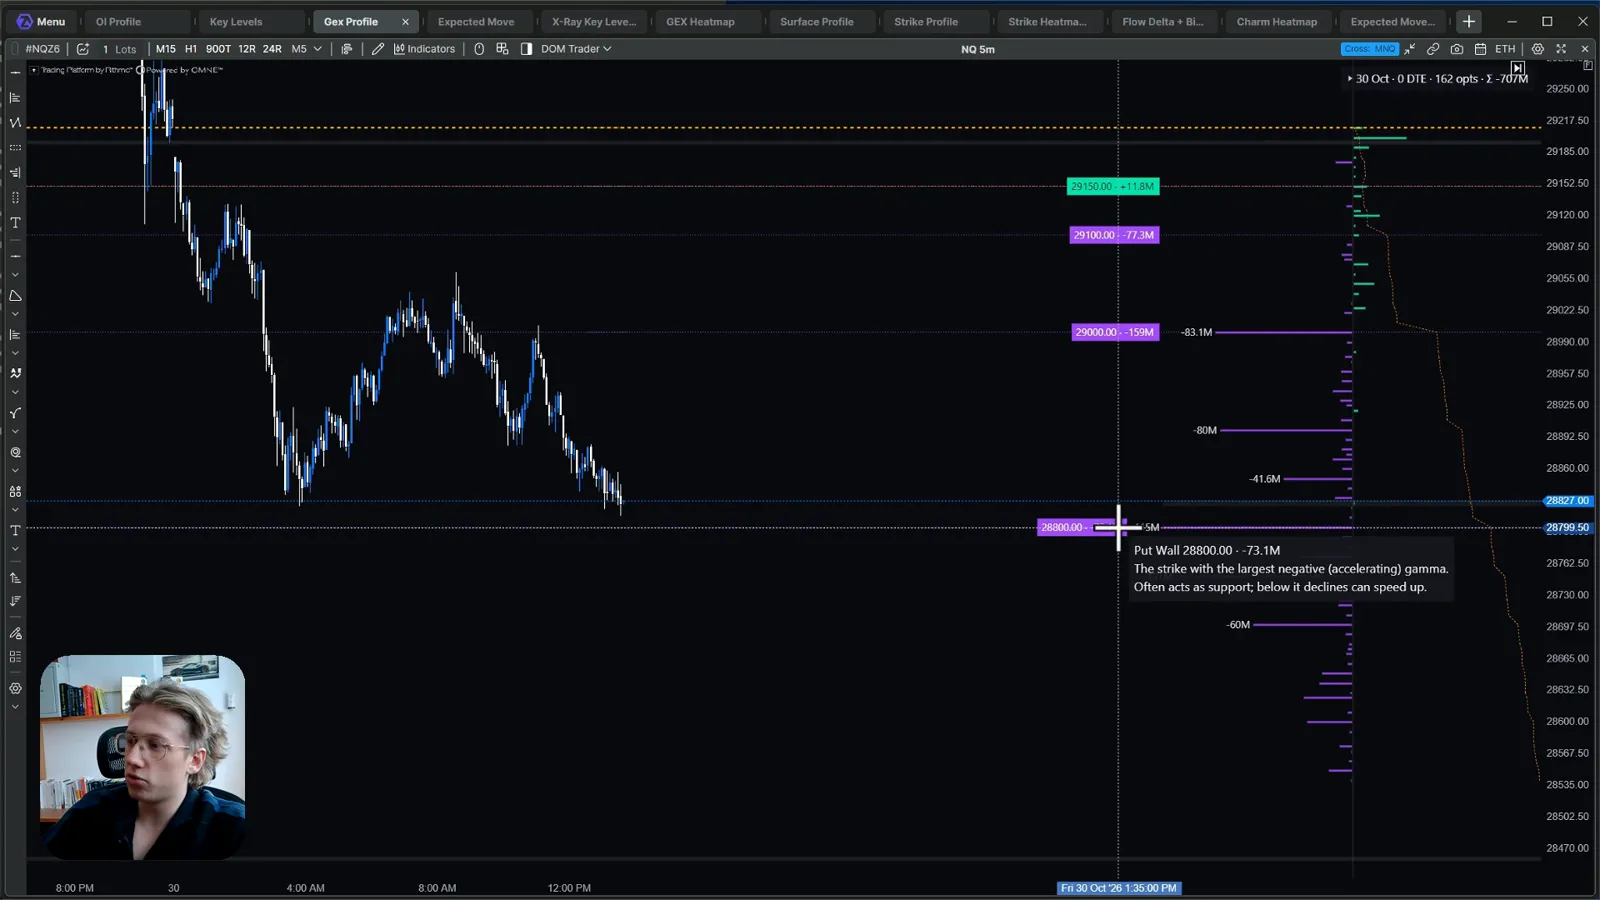
If you cannot find them, open settings, custom modules, and make sure the option suite (four indicators) and the advanced option suite (twelve) are enabled. Below is a short summary of what the video shows for each; every tool has its own detailed article, linked after each group.
Options Chain Suite (CME data, real-time feed)
- OI Profile: open interest per strike, calls and puts separately, or daily volume. In the video: net open interest, two-sided profile, 45 strikes per side, aggregation nearest series, expiration on auto. It shows where puts dominate, but it is not a gamma exposure calculation.
- Key Levels: call walls and put walls, usable on NQ and other futures such as gold and crude oil. I use three levels per type, which is my sweet spot, with expiration on auto.
- GEX Profile: net GEX per strike from open interest or daily volume, with walls, zero gamma and the overall regime.
- Expected Move: a corridor from implied volatility. Higher implied volatility means a wider corridor. A good estimate for the session, not a precise calculation, and the one I use least.
Options X-Ray (Cboe SPX data, ES only)
- Key Levels: walls, pin and flip. The default settings are good for most parts.
- GEX Heatmap and Surface Profile: where the current price sits in long or short gamma. The Surface Profile can switch to vanna (hedge per implied volatility point, market makers only), charm (max sell and max buy zones from time decay, with a scrubbing mode to see how it changed), and a hedge view showing how many contracts market makers have to buy or sell per 10 points.
- Strike Profile and Strike Heatmap: delta, gamma, vanna and charm exposure per strike, which I set to market makers and 0DTE. On the Strike Heatmap, the brighter the area, the more exposure. Red areas point to quicker moves, green areas often act like a magnet, buying gets dampened there.
- Big Trades, Flow Delta and Flow: delta exposure that retail, pros, firms and brokers add or cut, and how they reposition per bar.
- Charm Heatmap: where time decay alone creates sell or buy pressure for market makers, per five minutes. It becomes more important the further the session goes.
- Expected Move (X-Ray): the range the market is pricing in from implied volatility.
- Market State: the backdrop in one panel: the current gamma regime, the impulse from client flow, and the decay, meaning what market makers have to buy or sell from charm alone over the next 30 minutes, plus a history of past flow.
How do I use it on ES and NQ?
My focus is always on the walls, put walls and call walls, and on the gamma regime we are in.
- NQ: the GEX Profile from the Options Chain Suite. It gives me put walls, call walls, zero gamma as the flip zone, and the overall regime: are moves amplified or dampened?
- ES: the Market State, one of my favorites, in combination with the Surface Profile. Alternatively, a simple Strike Profile with GEX. The Strike Heatmap is one of the few tools I use to understand gamma exposure on ES.
None of it is an entry on its own. It tells me what kind of day to expect and where the hedging pressure sits. The trade itself still has to show up in the order flow when price gets there.
Where can you access these tools?
The options indicators shown in the video are part of ATAS X; the X-Ray needs the Ultra plan, the Chain Suite your own real-time CME options data. We are also building our own options module for ES and NQ, PFT Forge. It is in development and not released yet; you can join the waitlist.
FAQ
What is gamma exposure (GEX)?
Gamma exposure estimates how many futures dealers have to buy or sell to stay delta neutral as price moves. Per strike it is gamma times open interest times the contract multiplier times the spot price squared times 1%, summed over all strikes and expirations into net GEX.
What happens when the market is in negative gamma?
Dealers chase the move: they sell when price falls and buy when price rises. That tends to amplify moves in either direction, which gives breakouts more room. It describes a tendency, not a guaranteed outcome.
What is the zero gamma flip?
The price where net GEX crosses zero. Above it, the market is in a long gamma environment where moves tend to be dampened; below it, in a short gamma environment where moves tend to accelerate.
What are vanna and charm in options flow?
Vanna is how much delta changes when implied volatility changes, charm is how much delta changes as time passes. Both force dealers to re-hedge without any price move. A drop in implied volatility can create a vanna rally, and charm creates a slow drift into the close and into OPEX.
Are call walls and put walls support and resistance?
They often act that way, because dealers have to trade the most futures around those strikes. A call wall tends to see rallies sold, a put wall tends to see reactions, and a broken put wall can lead to erratic moves. They are estimates, not strict borders.
How do I see GEX levels in ATAS?
Under options analytics. The Options Chain Suite (Key Levels, GEX Profile) uses CME data through your Rithmic or Interactive Brokers connection and works on NQ and other futures. The Options X-Ray (GEX Heatmap, Strike Profile, Market State and more) uses SPX data, needs the Ultra plan and works on ES, MES, SPY and US 500.
This article is educational content, not financial advice.